Finnish vs Immigrants from Senegal Master's Degree
COMPARE
Finnish
Immigrants from Senegal
Master's Degree
Master's Degree Comparison
Finns
Immigrants from Senegal
14.2%
MASTER'S DEGREE
16.9/ 100
METRIC RATING
214th/ 347
METRIC RANK
15.5%
MASTER'S DEGREE
78.2/ 100
METRIC RATING
148th/ 347
METRIC RANK
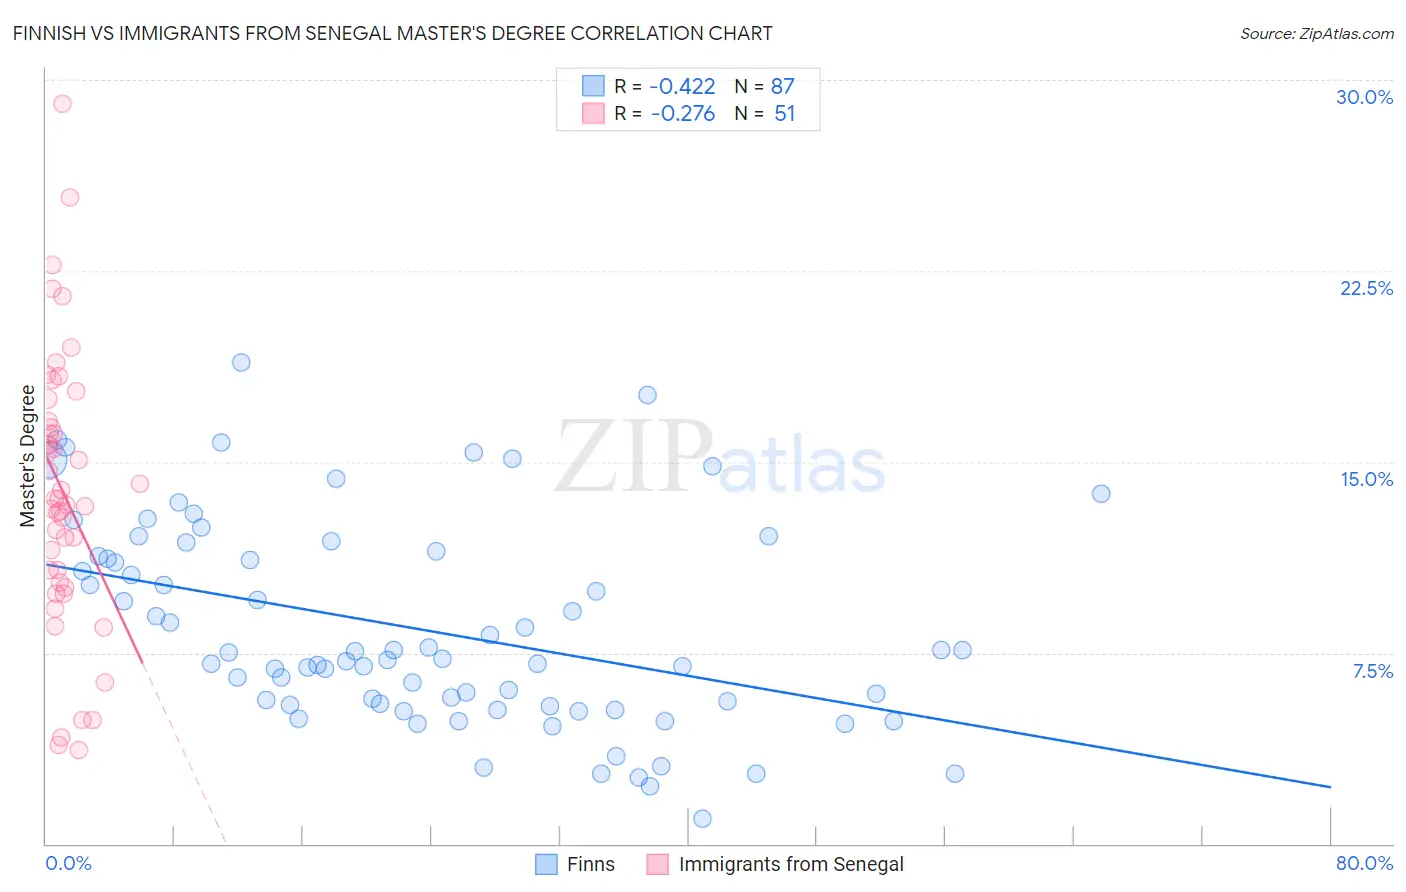
Finnish vs Immigrants from Senegal Master's Degree Correlation Chart
The statistical analysis conducted on geographies consisting of 404,580,183 people shows a moderate negative correlation between the proportion of Finns and percentage of population with at least master's degree education in the United States with a correlation coefficient (R) of -0.422 and weighted average of 14.2%. Similarly, the statistical analysis conducted on geographies consisting of 90,124,695 people shows a weak negative correlation between the proportion of Immigrants from Senegal and percentage of population with at least master's degree education in the United States with a correlation coefficient (R) of -0.276 and weighted average of 15.5%, a difference of 9.7%.
Master's Degree Correlation Summary
| Measurement | Finnish | Immigrants from Senegal |
| Minimum | 1.0% | 3.7% |
| Maximum | 18.9% | 29.1% |
| Range | 17.9% | 25.4% |
| Mean | 8.4% | 13.8% |
| Median | 7.3% | 13.5% |
| Interquartile 25% (IQ1) | 5.4% | 10.3% |
| Interquartile 75% (IQ3) | 11.3% | 16.6% |
| Interquartile Range (IQR) | 5.8% | 6.3% |
| Standard Deviation (Sample) | 4.0% | 5.4% |
| Standard Deviation (Population) | 4.0% | 5.3% |
Similar Demographics by Master's Degree
Demographics Similar to Finns by Master's Degree
In terms of master's degree, the demographic groups most similar to Finns are Immigrants from Thailand (14.2%, a difference of 0.010%), Spanish (14.2%, a difference of 0.20%), Immigrants from Vietnam (14.1%, a difference of 0.21%), Somali (14.2%, a difference of 0.25%), and Immigrants from Somalia (14.1%, a difference of 0.27%).
| Demographics | Rating | Rank | Master's Degree |
| Immigrants | Bosnia and Herzegovina | 22.0 /100 | #207 | Fair 14.3% |
| Immigrants | Barbados | 20.5 /100 | #208 | Fair 14.3% |
| Immigrants | Panama | 20.0 /100 | #209 | Fair 14.3% |
| Sub-Saharan Africans | 19.4 /100 | #210 | Poor 14.2% |
| Somalis | 18.0 /100 | #211 | Poor 14.2% |
| Spanish | 17.8 /100 | #212 | Poor 14.2% |
| Immigrants | Thailand | 17.0 /100 | #213 | Poor 14.2% |
| Finns | 16.9 /100 | #214 | Poor 14.2% |
| Immigrants | Vietnam | 16.1 /100 | #215 | Poor 14.1% |
| Immigrants | Somalia | 15.8 /100 | #216 | Poor 14.1% |
| Immigrants | Trinidad and Tobago | 15.8 /100 | #217 | Poor 14.1% |
| French Canadians | 14.9 /100 | #218 | Poor 14.1% |
| Norwegians | 13.6 /100 | #219 | Poor 14.0% |
| Germans | 13.1 /100 | #220 | Poor 14.0% |
| Koreans | 12.7 /100 | #221 | Poor 14.0% |
Demographics Similar to Immigrants from Senegal by Master's Degree
In terms of master's degree, the demographic groups most similar to Immigrants from Senegal are Ghanaian (15.5%, a difference of 0.010%), Slovene (15.5%, a difference of 0.040%), Iraqi (15.5%, a difference of 0.16%), Hungarian (15.6%, a difference of 0.17%), and Immigrants from Afghanistan (15.6%, a difference of 0.21%).
| Demographics | Rating | Rank | Master's Degree |
| Poles | 85.0 /100 | #141 | Excellent 15.7% |
| Immigrants | Africa | 84.0 /100 | #142 | Excellent 15.7% |
| Immigrants | Venezuela | 83.6 /100 | #143 | Excellent 15.7% |
| Canadians | 83.3 /100 | #144 | Excellent 15.7% |
| South Americans | 81.3 /100 | #145 | Excellent 15.6% |
| Immigrants | Afghanistan | 79.4 /100 | #146 | Good 15.6% |
| Hungarians | 79.1 /100 | #147 | Good 15.6% |
| Immigrants | Senegal | 78.2 /100 | #148 | Good 15.5% |
| Ghanaians | 78.2 /100 | #149 | Good 15.5% |
| Slovenes | 78.0 /100 | #150 | Good 15.5% |
| Iraqis | 77.3 /100 | #151 | Good 15.5% |
| Slavs | 77.0 /100 | #152 | Good 15.5% |
| Icelanders | 76.8 /100 | #153 | Good 15.5% |
| Immigrants | South America | 76.3 /100 | #154 | Good 15.5% |
| Immigrants | Bangladesh | 76.1 /100 | #155 | Good 15.5% |