Finnish vs Immigrants from Senegal Unemployment Among Ages 35 to 44 years
COMPARE
Finnish
Immigrants from Senegal
Unemployment Among Ages 35 to 44 years
Unemployment Among Ages 35 to 44 years Comparison
Finns
Immigrants from Senegal
4.5%
UNEMPLOYMENT AMONG AGES 35 TO 44 YEARS
91.6/ 100
METRIC RATING
104th/ 347
METRIC RANK
5.4%
UNEMPLOYMENT AMONG AGES 35 TO 44 YEARS
0.0/ 100
METRIC RATING
279th/ 347
METRIC RANK
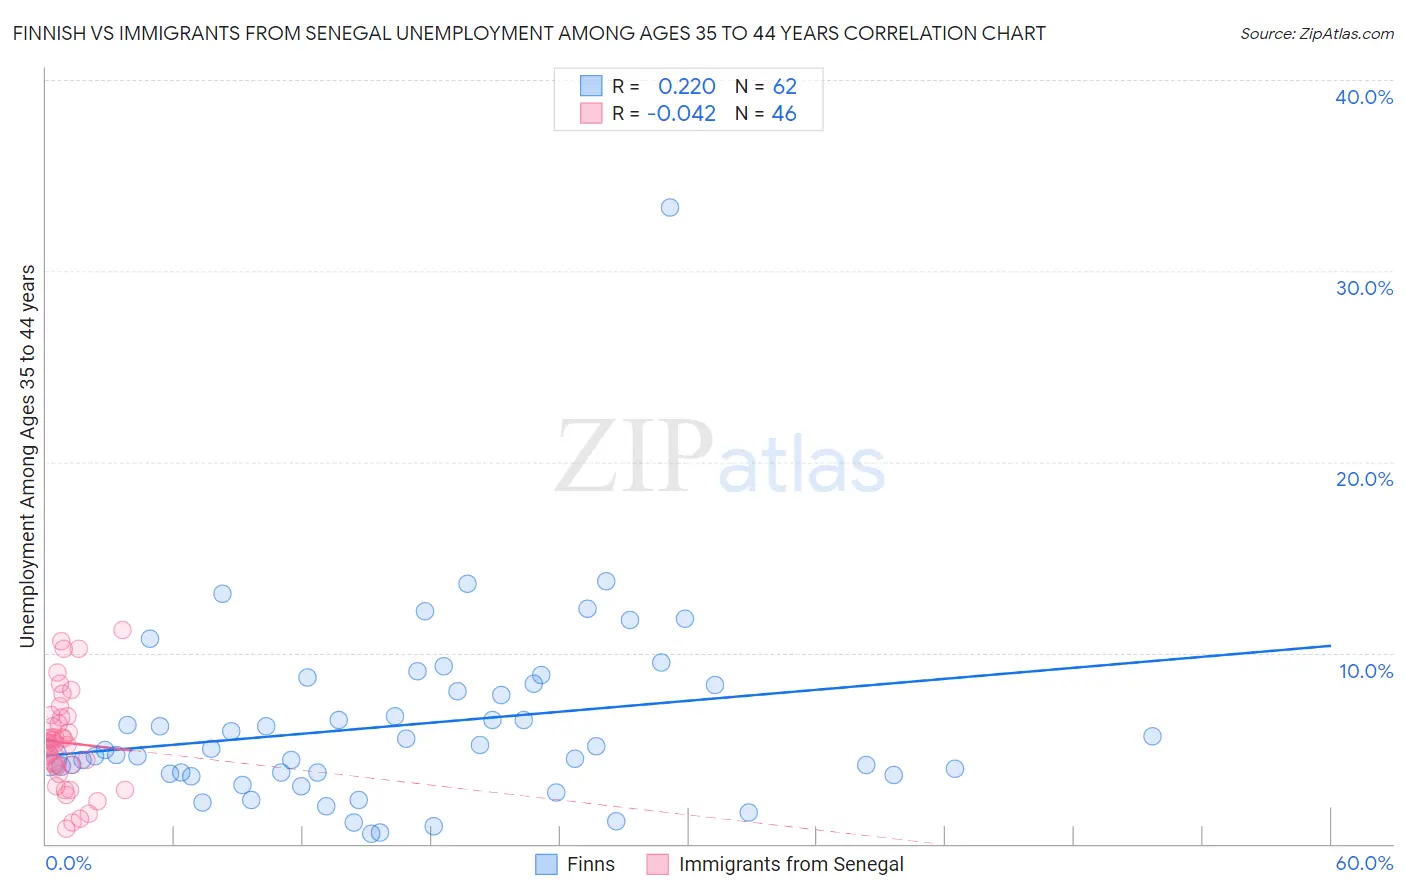
Finnish vs Immigrants from Senegal Unemployment Among Ages 35 to 44 years Correlation Chart
The statistical analysis conducted on geographies consisting of 391,570,263 people shows a weak positive correlation between the proportion of Finns and unemployment rate among population between the ages 35 and 44 in the United States with a correlation coefficient (R) of 0.220 and weighted average of 4.5%. Similarly, the statistical analysis conducted on geographies consisting of 89,848,104 people shows no correlation between the proportion of Immigrants from Senegal and unemployment rate among population between the ages 35 and 44 in the United States with a correlation coefficient (R) of -0.042 and weighted average of 5.4%, a difference of 19.8%.
Unemployment Among Ages 35 to 44 years Correlation Summary
| Measurement | Finnish | Immigrants from Senegal |
| Minimum | 0.50% | 0.80% |
| Maximum | 33.3% | 11.2% |
| Range | 32.8% | 10.4% |
| Mean | 6.2% | 5.3% |
| Median | 4.9% | 5.2% |
| Interquartile 25% (IQ1) | 3.7% | 4.0% |
| Interquartile 75% (IQ3) | 8.3% | 6.6% |
| Interquartile Range (IQR) | 4.6% | 2.6% |
| Standard Deviation (Sample) | 4.9% | 2.5% |
| Standard Deviation (Population) | 4.8% | 2.5% |
Similar Demographics by Unemployment Among Ages 35 to 44 years
Demographics Similar to Finns by Unemployment Among Ages 35 to 44 years
In terms of unemployment among ages 35 to 44 years, the demographic groups most similar to Finns are Welsh (4.5%, a difference of 0.020%), Immigrants from Sudan (4.5%, a difference of 0.050%), Immigrants from Saudi Arabia (4.5%, a difference of 0.060%), Immigrants from Netherlands (4.5%, a difference of 0.070%), and Italian (4.5%, a difference of 0.090%).
| Demographics | Rating | Rank | Unemployment Among Ages 35 to 44 years |
| Immigrants | France | 92.5 /100 | #97 | Exceptional 4.5% |
| Immigrants | Canada | 92.3 /100 | #98 | Exceptional 4.5% |
| Immigrants | Egypt | 92.3 /100 | #99 | Exceptional 4.5% |
| Italians | 91.9 /100 | #100 | Exceptional 4.5% |
| Immigrants | Netherlands | 91.9 /100 | #101 | Exceptional 4.5% |
| Immigrants | Sudan | 91.8 /100 | #102 | Exceptional 4.5% |
| Welsh | 91.6 /100 | #103 | Exceptional 4.5% |
| Finns | 91.6 /100 | #104 | Exceptional 4.5% |
| Immigrants | Saudi Arabia | 91.3 /100 | #105 | Exceptional 4.5% |
| Immigrants | North America | 91.1 /100 | #106 | Exceptional 4.5% |
| Immigrants | North Macedonia | 90.7 /100 | #107 | Exceptional 4.5% |
| New Zealanders | 90.3 /100 | #108 | Exceptional 4.5% |
| Romanians | 90.3 /100 | #109 | Exceptional 4.5% |
| Immigrants | Kazakhstan | 90.0 /100 | #110 | Excellent 4.5% |
| Immigrants | Nicaragua | 89.8 /100 | #111 | Excellent 4.5% |
Demographics Similar to Immigrants from Senegal by Unemployment Among Ages 35 to 44 years
In terms of unemployment among ages 35 to 44 years, the demographic groups most similar to Immigrants from Senegal are Lumbee (5.4%, a difference of 0.060%), Ecuadorian (5.4%, a difference of 0.17%), Immigrants from Portugal (5.4%, a difference of 0.21%), Immigrants from Caribbean (5.4%, a difference of 0.29%), and Native Hawaiian (5.4%, a difference of 0.36%).
| Demographics | Rating | Rank | Unemployment Among Ages 35 to 44 years |
| Senegalese | 0.0 /100 | #272 | Tragic 5.3% |
| Vietnamese | 0.0 /100 | #273 | Tragic 5.4% |
| Creek | 0.0 /100 | #274 | Tragic 5.4% |
| Immigrants | Mexico | 0.0 /100 | #275 | Tragic 5.4% |
| Native Hawaiians | 0.0 /100 | #276 | Tragic 5.4% |
| Immigrants | Caribbean | 0.0 /100 | #277 | Tragic 5.4% |
| Lumbee | 0.0 /100 | #278 | Tragic 5.4% |
| Immigrants | Senegal | 0.0 /100 | #279 | Tragic 5.4% |
| Ecuadorians | 0.0 /100 | #280 | Tragic 5.4% |
| Immigrants | Portugal | 0.0 /100 | #281 | Tragic 5.4% |
| Immigrants | Ghana | 0.0 /100 | #282 | Tragic 5.4% |
| Immigrants | Ecuador | 0.0 /100 | #283 | Tragic 5.4% |
| Haitians | 0.0 /100 | #284 | Tragic 5.5% |
| Hispanics or Latinos | 0.0 /100 | #285 | Tragic 5.5% |
| Immigrants | Micronesia | 0.0 /100 | #286 | Tragic 5.5% |