German vs Immigrants from Senegal Receiving Food Stamps
COMPARE
German
Immigrants from Senegal
Receiving Food Stamps
Receiving Food Stamps Comparison
Germans
Immigrants from Senegal
9.7%
RECEIVING FOOD STAMPS
99.2/ 100
METRIC RATING
60th/ 347
METRIC RANK
15.3%
RECEIVING FOOD STAMPS
0.0/ 100
METRIC RATING
289th/ 347
METRIC RANK
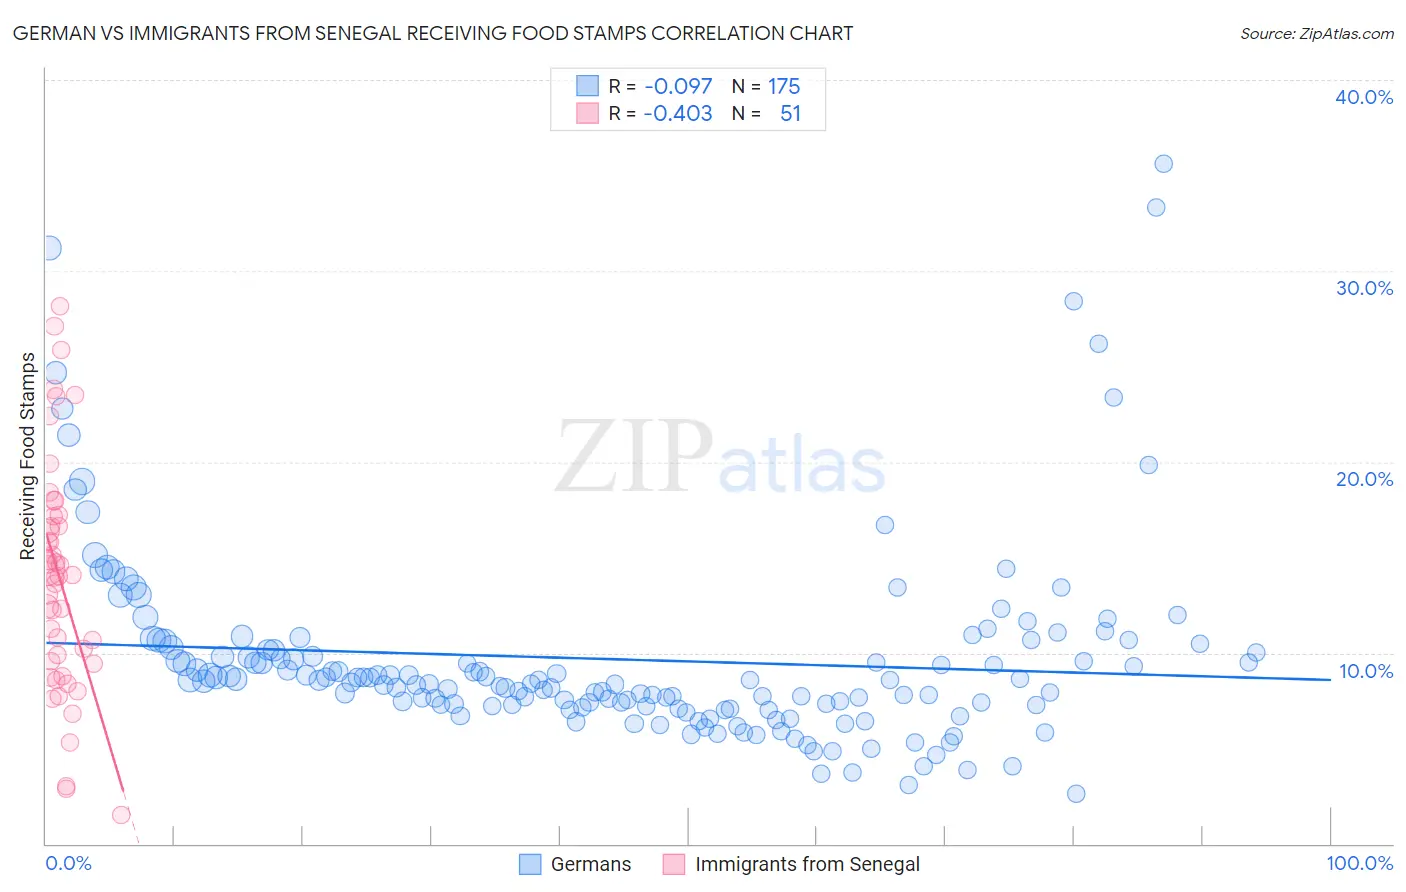
German vs Immigrants from Senegal Receiving Food Stamps Correlation Chart
The statistical analysis conducted on geographies consisting of 576,781,098 people shows a slight negative correlation between the proportion of Germans and percentage of population receiving government assistance and/or food stamps in the United States with a correlation coefficient (R) of -0.097 and weighted average of 9.7%. Similarly, the statistical analysis conducted on geographies consisting of 90,108,306 people shows a moderate negative correlation between the proportion of Immigrants from Senegal and percentage of population receiving government assistance and/or food stamps in the United States with a correlation coefficient (R) of -0.403 and weighted average of 15.3%, a difference of 57.5%.
Receiving Food Stamps Correlation Summary
| Measurement | German | Immigrants from Senegal |
| Minimum | 2.6% | 1.5% |
| Maximum | 35.6% | 28.1% |
| Range | 33.0% | 26.6% |
| Mean | 9.7% | 13.9% |
| Median | 8.6% | 14.0% |
| Interquartile 25% (IQ1) | 7.2% | 9.4% |
| Interquartile 75% (IQ3) | 10.1% | 17.1% |
| Interquartile Range (IQR) | 2.9% | 7.7% |
| Standard Deviation (Sample) | 5.1% | 6.1% |
| Standard Deviation (Population) | 5.1% | 6.0% |
Similar Demographics by Receiving Food Stamps
Demographics Similar to Germans by Receiving Food Stamps
In terms of receiving food stamps, the demographic groups most similar to Germans are British (9.7%, a difference of 0.10%), Scandinavian (9.7%, a difference of 0.13%), English (9.8%, a difference of 0.14%), Greek (9.7%, a difference of 0.19%), and Immigrants from Bulgaria (9.8%, a difference of 0.22%).
| Demographics | Rating | Rank | Receiving Food Stamps |
| Tongans | 99.3 /100 | #53 | Exceptional 9.7% |
| Swiss | 99.3 /100 | #54 | Exceptional 9.7% |
| Immigrants | Switzerland | 99.3 /100 | #55 | Exceptional 9.7% |
| Immigrants | Canada | 99.3 /100 | #56 | Exceptional 9.7% |
| Greeks | 99.3 /100 | #57 | Exceptional 9.7% |
| Scandinavians | 99.2 /100 | #58 | Exceptional 9.7% |
| British | 99.2 /100 | #59 | Exceptional 9.7% |
| Germans | 99.2 /100 | #60 | Exceptional 9.7% |
| English | 99.2 /100 | #61 | Exceptional 9.8% |
| Immigrants | Bulgaria | 99.2 /100 | #62 | Exceptional 9.8% |
| Chinese | 99.2 /100 | #63 | Exceptional 9.8% |
| Immigrants | North America | 99.2 /100 | #64 | Exceptional 9.8% |
| Immigrants | Turkey | 99.1 /100 | #65 | Exceptional 9.8% |
| Slovenes | 99.1 /100 | #66 | Exceptional 9.8% |
| Immigrants | Indonesia | 99.0 /100 | #67 | Exceptional 9.8% |
Demographics Similar to Immigrants from Senegal by Receiving Food Stamps
In terms of receiving food stamps, the demographic groups most similar to Immigrants from Senegal are Senegalese (15.4%, a difference of 0.27%), Immigrants from Belize (15.2%, a difference of 0.77%), Immigrants from Mexico (15.2%, a difference of 1.2%), Honduran (15.5%, a difference of 1.3%), and African (15.1%, a difference of 1.5%).
| Demographics | Rating | Rank | Receiving Food Stamps |
| Immigrants | Central America | 0.0 /100 | #282 | Tragic 15.0% |
| Bangladeshis | 0.0 /100 | #283 | Tragic 15.0% |
| Immigrants | Ecuador | 0.0 /100 | #284 | Tragic 15.0% |
| Immigrants | Liberia | 0.0 /100 | #285 | Tragic 15.1% |
| Africans | 0.0 /100 | #286 | Tragic 15.1% |
| Immigrants | Mexico | 0.0 /100 | #287 | Tragic 15.2% |
| Immigrants | Belize | 0.0 /100 | #288 | Tragic 15.2% |
| Immigrants | Senegal | 0.0 /100 | #289 | Tragic 15.3% |
| Senegalese | 0.0 /100 | #290 | Tragic 15.4% |
| Hondurans | 0.0 /100 | #291 | Tragic 15.5% |
| Alaska Natives | 0.0 /100 | #292 | Tragic 15.6% |
| Vietnamese | 0.0 /100 | #293 | Tragic 15.7% |
| Immigrants | Latin America | 0.0 /100 | #294 | Tragic 15.7% |
| Immigrants | Honduras | 0.0 /100 | #295 | Tragic 15.7% |
| Tsimshian | 0.0 /100 | #296 | Tragic 15.7% |