Immigrants from Egypt vs Haitian Receiving Food Stamps
COMPARE
Immigrants from Egypt
Haitian
Receiving Food Stamps
Receiving Food Stamps Comparison
Immigrants from Egypt
Haitians
10.3%
RECEIVING FOOD STAMPS
97.1/ 100
METRIC RATING
98th/ 347
METRIC RANK
17.8%
RECEIVING FOOD STAMPS
0.0/ 100
METRIC RATING
323rd/ 347
METRIC RANK
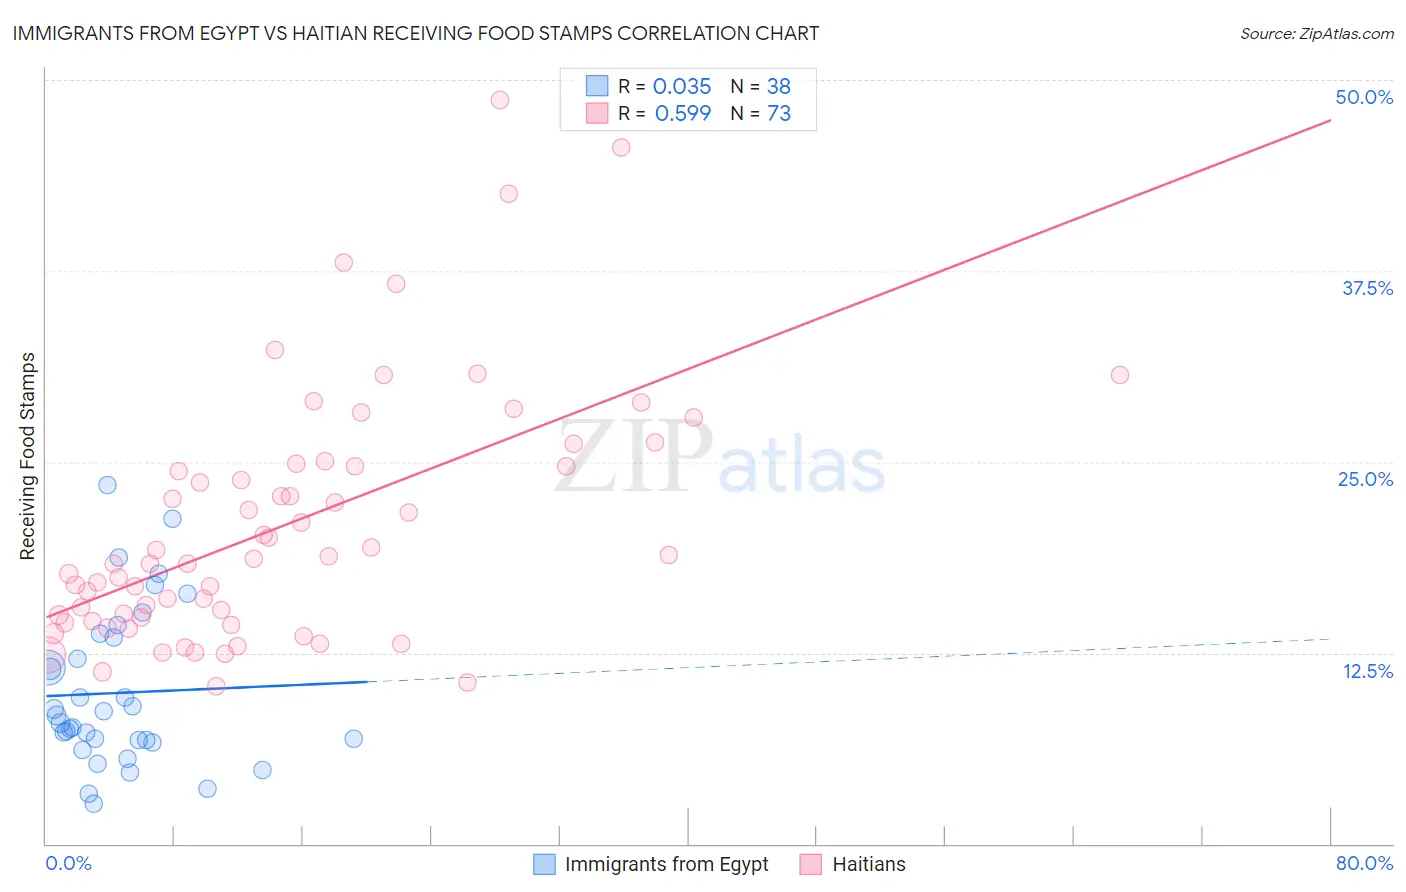
Immigrants from Egypt vs Haitian Receiving Food Stamps Correlation Chart
The statistical analysis conducted on geographies consisting of 245,027,906 people shows no correlation between the proportion of Immigrants from Egypt and percentage of population receiving government assistance and/or food stamps in the United States with a correlation coefficient (R) of 0.035 and weighted average of 10.3%. Similarly, the statistical analysis conducted on geographies consisting of 287,415,058 people shows a substantial positive correlation between the proportion of Haitians and percentage of population receiving government assistance and/or food stamps in the United States with a correlation coefficient (R) of 0.599 and weighted average of 17.8%, a difference of 72.8%.
Receiving Food Stamps Correlation Summary
| Measurement | Immigrants from Egypt | Haitian |
| Minimum | 2.6% | 10.3% |
| Maximum | 23.5% | 48.7% |
| Range | 20.9% | 38.4% |
| Mean | 9.9% | 20.9% |
| Median | 8.2% | 18.7% |
| Interquartile 25% (IQ1) | 6.8% | 14.7% |
| Interquartile 75% (IQ3) | 13.5% | 24.8% |
| Interquartile Range (IQR) | 6.7% | 10.1% |
| Standard Deviation (Sample) | 5.1% | 8.2% |
| Standard Deviation (Population) | 5.0% | 8.1% |
Similar Demographics by Receiving Food Stamps
Demographics Similar to Immigrants from Egypt by Receiving Food Stamps
In terms of receiving food stamps, the demographic groups most similar to Immigrants from Egypt are Czechoslovakian (10.3%, a difference of 0.060%), Serbian (10.3%, a difference of 0.17%), Immigrants from Western Europe (10.3%, a difference of 0.30%), Palestinian (10.3%, a difference of 0.30%), and Welsh (10.3%, a difference of 0.31%).
| Demographics | Rating | Rank | Receiving Food Stamps |
| Jordanians | 97.9 /100 | #91 | Exceptional 10.2% |
| Irish | 97.9 /100 | #92 | Exceptional 10.2% |
| Belgians | 97.7 /100 | #93 | Exceptional 10.2% |
| Immigrants | Greece | 97.4 /100 | #94 | Exceptional 10.3% |
| Basques | 97.4 /100 | #95 | Exceptional 10.3% |
| Welsh | 97.3 /100 | #96 | Exceptional 10.3% |
| Czechoslovakians | 97.2 /100 | #97 | Exceptional 10.3% |
| Immigrants | Egypt | 97.1 /100 | #98 | Exceptional 10.3% |
| Serbians | 97.0 /100 | #99 | Exceptional 10.3% |
| Immigrants | Western Europe | 96.9 /100 | #100 | Exceptional 10.3% |
| Palestinians | 96.9 /100 | #101 | Exceptional 10.3% |
| Immigrants | Europe | 96.8 /100 | #102 | Exceptional 10.3% |
| Immigrants | Latvia | 96.8 /100 | #103 | Exceptional 10.3% |
| Immigrants | Hungary | 96.7 /100 | #104 | Exceptional 10.3% |
| Immigrants | Malaysia | 96.5 /100 | #105 | Exceptional 10.4% |
Demographics Similar to Haitians by Receiving Food Stamps
In terms of receiving food stamps, the demographic groups most similar to Haitians are Immigrants from Grenada (17.8%, a difference of 0.010%), British West Indian (17.9%, a difference of 0.59%), Immigrants from Haiti (18.2%, a difference of 2.4%), Cuban (18.2%, a difference of 2.5%), and Apache (18.3%, a difference of 2.8%).
| Demographics | Rating | Rank | Receiving Food Stamps |
| Central American Indians | 0.0 /100 | #316 | Tragic 17.1% |
| Blacks/African Americans | 0.0 /100 | #317 | Tragic 17.2% |
| Menominee | 0.0 /100 | #318 | Tragic 17.2% |
| Immigrants | St. Vincent and the Grenadines | 0.0 /100 | #319 | Tragic 17.2% |
| Immigrants | Nicaragua | 0.0 /100 | #320 | Tragic 17.2% |
| Natives/Alaskans | 0.0 /100 | #321 | Tragic 17.3% |
| Immigrants | Grenada | 0.0 /100 | #322 | Tragic 17.8% |
| Haitians | 0.0 /100 | #323 | Tragic 17.8% |
| British West Indians | 0.0 /100 | #324 | Tragic 17.9% |
| Immigrants | Haiti | 0.0 /100 | #325 | Tragic 18.2% |
| Cubans | 0.0 /100 | #326 | Tragic 18.2% |
| Apache | 0.0 /100 | #327 | Tragic 18.3% |
| Colville | 0.0 /100 | #328 | Tragic 18.3% |
| Immigrants | Dominica | 0.0 /100 | #329 | Tragic 18.4% |
| Pima | 0.0 /100 | #330 | Tragic 19.0% |