Finnish vs Haitian Bachelor's Degree
COMPARE
Finnish
Haitian
Bachelor's Degree
Bachelor's Degree Comparison
Finns
Haitians
36.7%
BACHELOR'S DEGREE
22.2/ 100
METRIC RATING
205th/ 347
METRIC RANK
31.3%
BACHELOR'S DEGREE
0.1/ 100
METRIC RATING
284th/ 347
METRIC RANK
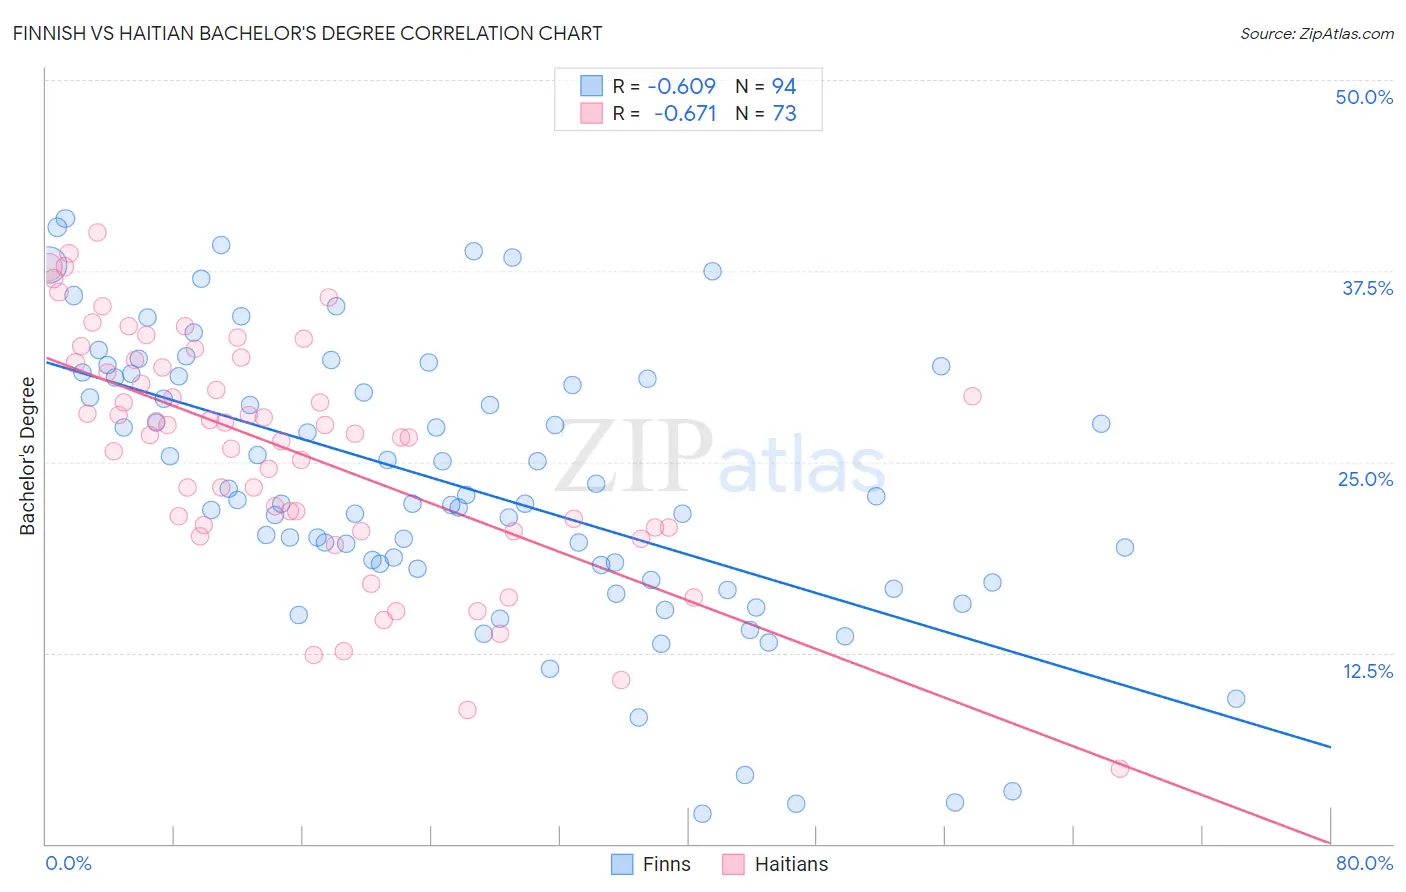
Finnish vs Haitian Bachelor's Degree Correlation Chart
The statistical analysis conducted on geographies consisting of 404,648,142 people shows a significant negative correlation between the proportion of Finns and percentage of population with at least bachelor's degree education in the United States with a correlation coefficient (R) of -0.609 and weighted average of 36.7%. Similarly, the statistical analysis conducted on geographies consisting of 287,970,705 people shows a significant negative correlation between the proportion of Haitians and percentage of population with at least bachelor's degree education in the United States with a correlation coefficient (R) of -0.671 and weighted average of 31.3%, a difference of 17.1%.
Bachelor's Degree Correlation Summary
| Measurement | Finnish | Haitian |
| Minimum | 2.0% | 4.9% |
| Maximum | 40.9% | 40.1% |
| Range | 38.9% | 35.1% |
| Mean | 23.4% | 25.8% |
| Median | 22.4% | 26.9% |
| Interquartile 25% (IQ1) | 18.0% | 20.7% |
| Interquartile 75% (IQ3) | 30.5% | 31.6% |
| Interquartile Range (IQR) | 12.6% | 10.8% |
| Standard Deviation (Sample) | 9.0% | 7.6% |
| Standard Deviation (Population) | 9.0% | 7.6% |
Similar Demographics by Bachelor's Degree
Demographics Similar to Finns by Bachelor's Degree
In terms of bachelor's degree, the demographic groups most similar to Finns are Immigrants (36.7%, a difference of 0.10%), Immigrants from Nigeria (36.7%, a difference of 0.14%), Spaniard (36.6%, a difference of 0.14%), Immigrants from Middle Africa (36.6%, a difference of 0.23%), and Immigrants from Zaire (36.8%, a difference of 0.43%).
| Demographics | Rating | Rank | Bachelor's Degree |
| Welsh | 29.1 /100 | #198 | Fair 37.0% |
| Immigrants | Costa Rica | 27.4 /100 | #199 | Fair 36.9% |
| Immigrants | Ghana | 27.4 /100 | #200 | Fair 36.9% |
| Immigrants | South Eastern Asia | 25.4 /100 | #201 | Fair 36.8% |
| Immigrants | Zaire | 25.3 /100 | #202 | Fair 36.8% |
| Immigrants | Nigeria | 23.1 /100 | #203 | Fair 36.7% |
| Immigrants | Immigrants | 22.8 /100 | #204 | Fair 36.7% |
| Finns | 22.2 /100 | #205 | Fair 36.7% |
| Spaniards | 21.2 /100 | #206 | Fair 36.6% |
| Immigrants | Middle Africa | 20.6 /100 | #207 | Fair 36.6% |
| Immigrants | Thailand | 19.4 /100 | #208 | Poor 36.5% |
| Panamanians | 18.8 /100 | #209 | Poor 36.5% |
| French | 18.6 /100 | #210 | Poor 36.5% |
| Scotch-Irish | 18.3 /100 | #211 | Poor 36.4% |
| Immigrants | Philippines | 17.8 /100 | #212 | Poor 36.4% |
Demographics Similar to Haitians by Bachelor's Degree
In terms of bachelor's degree, the demographic groups most similar to Haitians are Aleut (31.3%, a difference of 0.010%), Honduran (31.3%, a difference of 0.030%), Immigrants from El Salvador (31.3%, a difference of 0.070%), Immigrants from Caribbean (31.4%, a difference of 0.31%), and Blackfeet (31.5%, a difference of 0.45%).
| Demographics | Rating | Rank | Bachelor's Degree |
| Dominicans | 0.1 /100 | #277 | Tragic 31.8% |
| Marshallese | 0.1 /100 | #278 | Tragic 31.7% |
| Hawaiians | 0.1 /100 | #279 | Tragic 31.6% |
| Immigrants | Laos | 0.1 /100 | #280 | Tragic 31.6% |
| Blackfeet | 0.1 /100 | #281 | Tragic 31.5% |
| Immigrants | Caribbean | 0.1 /100 | #282 | Tragic 31.4% |
| Hondurans | 0.1 /100 | #283 | Tragic 31.3% |
| Haitians | 0.1 /100 | #284 | Tragic 31.3% |
| Aleuts | 0.1 /100 | #285 | Tragic 31.3% |
| Immigrants | El Salvador | 0.1 /100 | #286 | Tragic 31.3% |
| Ottawa | 0.1 /100 | #287 | Tragic 31.1% |
| Guatemalans | 0.1 /100 | #288 | Tragic 31.0% |
| Puerto Ricans | 0.1 /100 | #289 | Tragic 31.0% |
| Immigrants | Honduras | 0.1 /100 | #290 | Tragic 30.9% |
| Blacks/African Americans | 0.1 /100 | #291 | Tragic 30.9% |