Scottish vs Haitian Receiving Food Stamps
COMPARE
Scottish
Haitian
Receiving Food Stamps
Receiving Food Stamps Comparison
Scottish
Haitians
9.9%
RECEIVING FOOD STAMPS
98.9/ 100
METRIC RATING
71st/ 347
METRIC RANK
17.8%
RECEIVING FOOD STAMPS
0.0/ 100
METRIC RATING
323rd/ 347
METRIC RANK
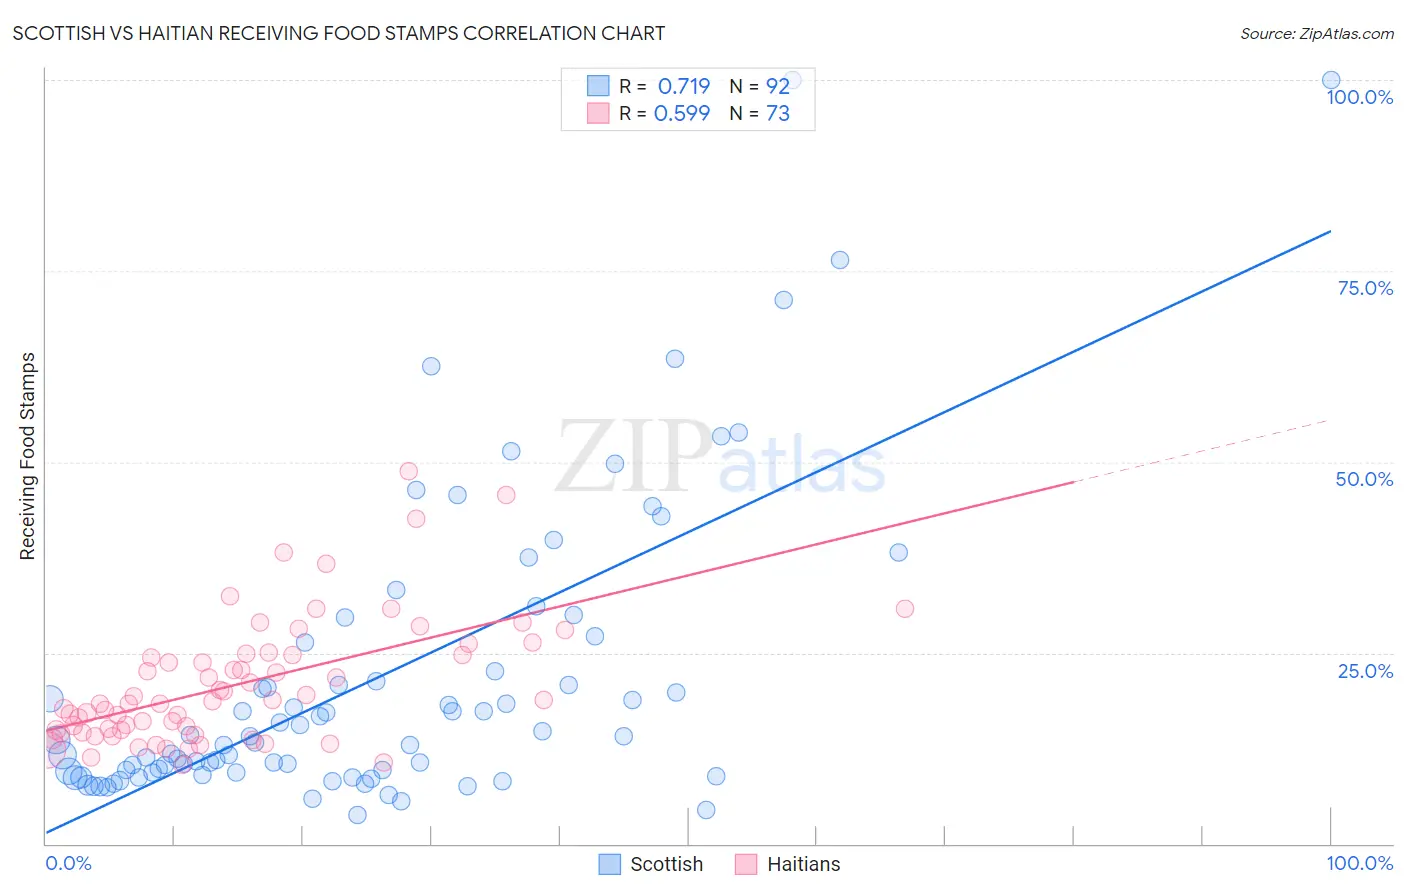
Scottish vs Haitian Receiving Food Stamps Correlation Chart
The statistical analysis conducted on geographies consisting of 563,544,150 people shows a strong positive correlation between the proportion of Scottish and percentage of population receiving government assistance and/or food stamps in the United States with a correlation coefficient (R) of 0.719 and weighted average of 9.9%. Similarly, the statistical analysis conducted on geographies consisting of 287,415,058 people shows a substantial positive correlation between the proportion of Haitians and percentage of population receiving government assistance and/or food stamps in the United States with a correlation coefficient (R) of 0.599 and weighted average of 17.8%, a difference of 80.1%.
Receiving Food Stamps Correlation Summary
| Measurement | Scottish | Haitian |
| Minimum | 3.7% | 10.3% |
| Maximum | 100.0% | 48.7% |
| Range | 96.3% | 38.4% |
| Mean | 21.7% | 20.9% |
| Median | 13.8% | 18.7% |
| Interquartile 25% (IQ1) | 9.4% | 14.7% |
| Interquartile 75% (IQ3) | 24.5% | 24.8% |
| Interquartile Range (IQR) | 15.1% | 10.1% |
| Standard Deviation (Sample) | 19.9% | 8.2% |
| Standard Deviation (Population) | 19.8% | 8.1% |
Similar Demographics by Receiving Food Stamps
Demographics Similar to Scottish by Receiving Food Stamps
In terms of receiving food stamps, the demographic groups most similar to Scottish are Immigrants from Serbia (9.9%, a difference of 0.13%), Italian (9.9%, a difference of 0.18%), Immigrants from Asia (9.9%, a difference of 0.24%), Macedonian (9.9%, a difference of 0.30%), and Northern European (9.8%, a difference of 0.39%).
| Demographics | Rating | Rank | Receiving Food Stamps |
| Immigrants | North America | 99.2 /100 | #64 | Exceptional 9.8% |
| Immigrants | Turkey | 99.1 /100 | #65 | Exceptional 9.8% |
| Slovenes | 99.1 /100 | #66 | Exceptional 9.8% |
| Immigrants | Indonesia | 99.0 /100 | #67 | Exceptional 9.8% |
| Northern Europeans | 99.0 /100 | #68 | Exceptional 9.8% |
| Italians | 99.0 /100 | #69 | Exceptional 9.9% |
| Immigrants | Serbia | 99.0 /100 | #70 | Exceptional 9.9% |
| Scottish | 98.9 /100 | #71 | Exceptional 9.9% |
| Immigrants | Asia | 98.9 /100 | #72 | Exceptional 9.9% |
| Macedonians | 98.9 /100 | #73 | Exceptional 9.9% |
| New Zealanders | 98.8 /100 | #74 | Exceptional 9.9% |
| Immigrants | Zimbabwe | 98.7 /100 | #75 | Exceptional 9.9% |
| Immigrants | Croatia | 98.7 /100 | #76 | Exceptional 10.0% |
| Immigrants | North Macedonia | 98.7 /100 | #77 | Exceptional 10.0% |
| South Africans | 98.7 /100 | #78 | Exceptional 10.0% |
Demographics Similar to Haitians by Receiving Food Stamps
In terms of receiving food stamps, the demographic groups most similar to Haitians are Immigrants from Grenada (17.8%, a difference of 0.010%), British West Indian (17.9%, a difference of 0.59%), Immigrants from Haiti (18.2%, a difference of 2.4%), Cuban (18.2%, a difference of 2.5%), and Apache (18.3%, a difference of 2.8%).
| Demographics | Rating | Rank | Receiving Food Stamps |
| Central American Indians | 0.0 /100 | #316 | Tragic 17.1% |
| Blacks/African Americans | 0.0 /100 | #317 | Tragic 17.2% |
| Menominee | 0.0 /100 | #318 | Tragic 17.2% |
| Immigrants | St. Vincent and the Grenadines | 0.0 /100 | #319 | Tragic 17.2% |
| Immigrants | Nicaragua | 0.0 /100 | #320 | Tragic 17.2% |
| Natives/Alaskans | 0.0 /100 | #321 | Tragic 17.3% |
| Immigrants | Grenada | 0.0 /100 | #322 | Tragic 17.8% |
| Haitians | 0.0 /100 | #323 | Tragic 17.8% |
| British West Indians | 0.0 /100 | #324 | Tragic 17.9% |
| Immigrants | Haiti | 0.0 /100 | #325 | Tragic 18.2% |
| Cubans | 0.0 /100 | #326 | Tragic 18.2% |
| Apache | 0.0 /100 | #327 | Tragic 18.3% |
| Colville | 0.0 /100 | #328 | Tragic 18.3% |
| Immigrants | Dominica | 0.0 /100 | #329 | Tragic 18.4% |
| Pima | 0.0 /100 | #330 | Tragic 19.0% |