Ethiopian vs Immigrants from Morocco Disability Age 65 to 74
COMPARE
Ethiopian
Immigrants from Morocco
Disability Age 65 to 74
Disability Age 65 to 74 Comparison
Ethiopians
Immigrants from Morocco
22.7%
DISABILITY AGE 65 TO 74
87.9/ 100
METRIC RATING
136th/ 347
METRIC RANK
22.9%
DISABILITY AGE 65 TO 74
77.6/ 100
METRIC RATING
151st/ 347
METRIC RANK
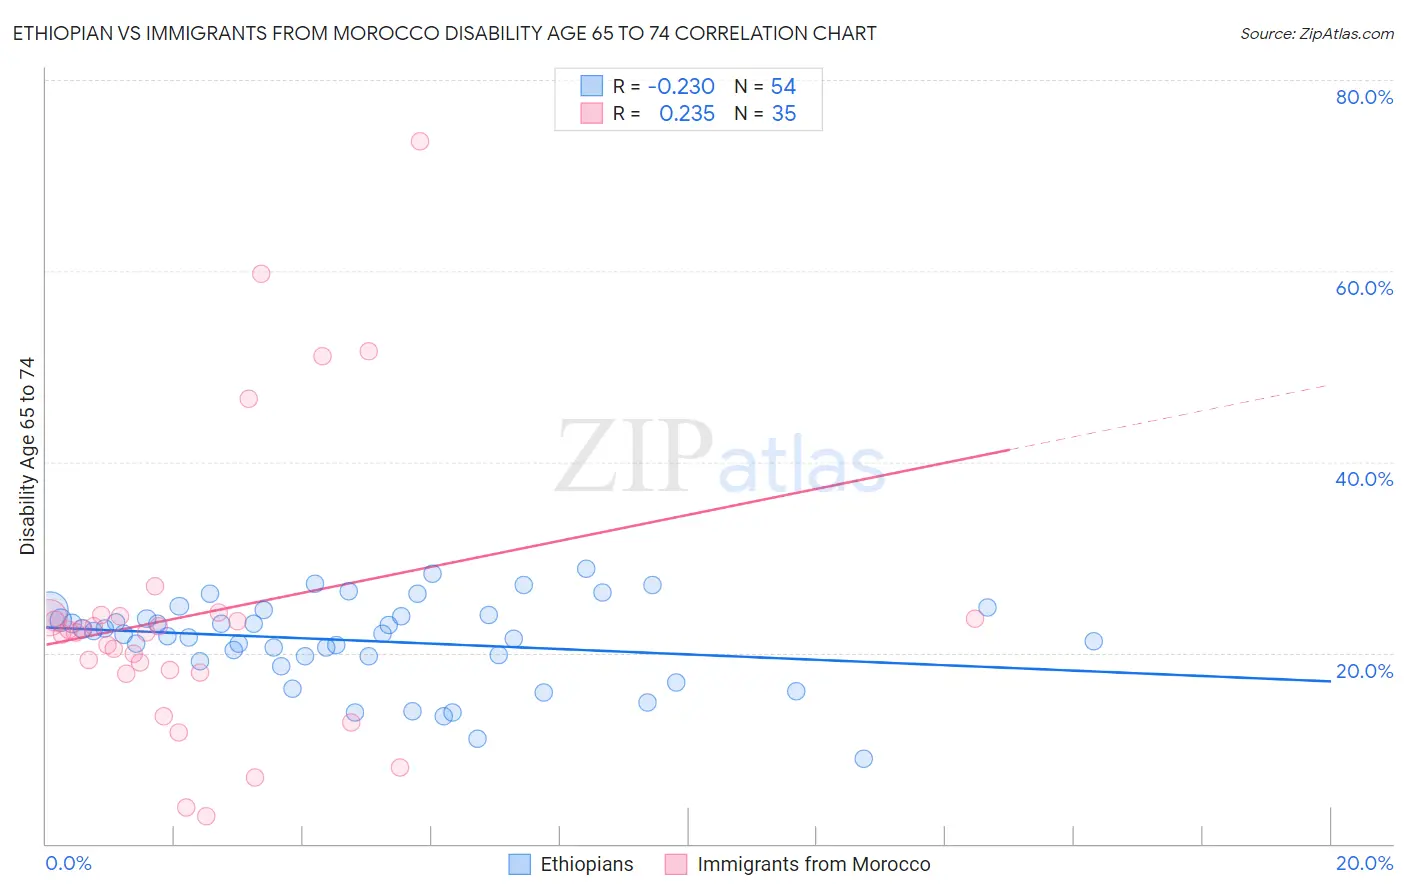
Ethiopian vs Immigrants from Morocco Disability Age 65 to 74 Correlation Chart
The statistical analysis conducted on geographies consisting of 222,880,036 people shows a weak negative correlation between the proportion of Ethiopians and percentage of population with a disability between the ages 65 and 75 in the United States with a correlation coefficient (R) of -0.230 and weighted average of 22.7%. Similarly, the statistical analysis conducted on geographies consisting of 178,856,303 people shows a weak positive correlation between the proportion of Immigrants from Morocco and percentage of population with a disability between the ages 65 and 75 in the United States with a correlation coefficient (R) of 0.235 and weighted average of 22.9%, a difference of 1.1%.
Disability Age 65 to 74 Correlation Summary
| Measurement | Ethiopian | Immigrants from Morocco |
| Minimum | 8.9% | 2.9% |
| Maximum | 28.8% | 73.6% |
| Range | 19.9% | 70.7% |
| Mean | 21.3% | 24.1% |
| Median | 22.0% | 22.1% |
| Interquartile 25% (IQ1) | 19.6% | 17.9% |
| Interquartile 75% (IQ3) | 24.0% | 23.9% |
| Interquartile Range (IQR) | 4.4% | 6.0% |
| Standard Deviation (Sample) | 4.5% | 15.1% |
| Standard Deviation (Population) | 4.4% | 14.9% |
Demographics Similar to Ethiopians and Immigrants from Morocco by Disability Age 65 to 74
In terms of disability age 65 to 74, the demographic groups most similar to Ethiopians are Taiwanese (22.7%, a difference of 0.030%), Immigrants from Ukraine (22.6%, a difference of 0.070%), Immigrants from Moldova (22.7%, a difference of 0.090%), Afghan (22.6%, a difference of 0.10%), and Northern European (22.6%, a difference of 0.15%). Similarly, the demographic groups most similar to Immigrants from Morocco are Canadian (22.9%, a difference of 0.0%), Finnish (22.9%, a difference of 0.090%), Swiss (22.9%, a difference of 0.18%), New Zealander (22.9%, a difference of 0.20%), and Slavic (23.0%, a difference of 0.20%).
| Demographics | Rating | Rank | Disability Age 65 to 74 |
| Northern Europeans | 88.9 /100 | #133 | Excellent 22.6% |
| Afghans | 88.6 /100 | #134 | Excellent 22.6% |
| Immigrants | Ukraine | 88.4 /100 | #135 | Excellent 22.6% |
| Ethiopians | 87.9 /100 | #136 | Excellent 22.7% |
| Taiwanese | 87.6 /100 | #137 | Excellent 22.7% |
| Immigrants | Moldova | 87.3 /100 | #138 | Excellent 22.7% |
| Immigrants | Syria | 85.8 /100 | #139 | Excellent 22.7% |
| Ugandans | 85.4 /100 | #140 | Excellent 22.7% |
| Belgians | 85.3 /100 | #141 | Excellent 22.7% |
| Immigrants | Ethiopia | 85.3 /100 | #142 | Excellent 22.7% |
| Arabs | 84.8 /100 | #143 | Excellent 22.8% |
| Danes | 84.4 /100 | #144 | Excellent 22.8% |
| Immigrants | Uganda | 84.0 /100 | #145 | Excellent 22.8% |
| Alsatians | 83.7 /100 | #146 | Excellent 22.8% |
| Immigrants | Uzbekistan | 83.1 /100 | #147 | Excellent 22.8% |
| New Zealanders | 79.9 /100 | #148 | Good 22.9% |
| Swiss | 79.7 /100 | #149 | Good 22.9% |
| Canadians | 77.7 /100 | #150 | Good 22.9% |
| Immigrants | Morocco | 77.6 /100 | #151 | Good 22.9% |
| Finns | 76.5 /100 | #152 | Good 22.9% |
| Slavs | 75.2 /100 | #153 | Good 23.0% |