Egyptian vs Crow Married-Couple Family Poverty
COMPARE
Egyptian
Crow
Married-Couple Family Poverty
Married-Couple Family Poverty Comparison
Egyptians
Crow
4.8%
MARRIED-COUPLE FAMILY POVERTY
92.0/ 100
METRIC RATING
127th/ 347
METRIC RANK
9.6%
MARRIED-COUPLE FAMILY POVERTY
0.0/ 100
METRIC RATING
339th/ 347
METRIC RANK
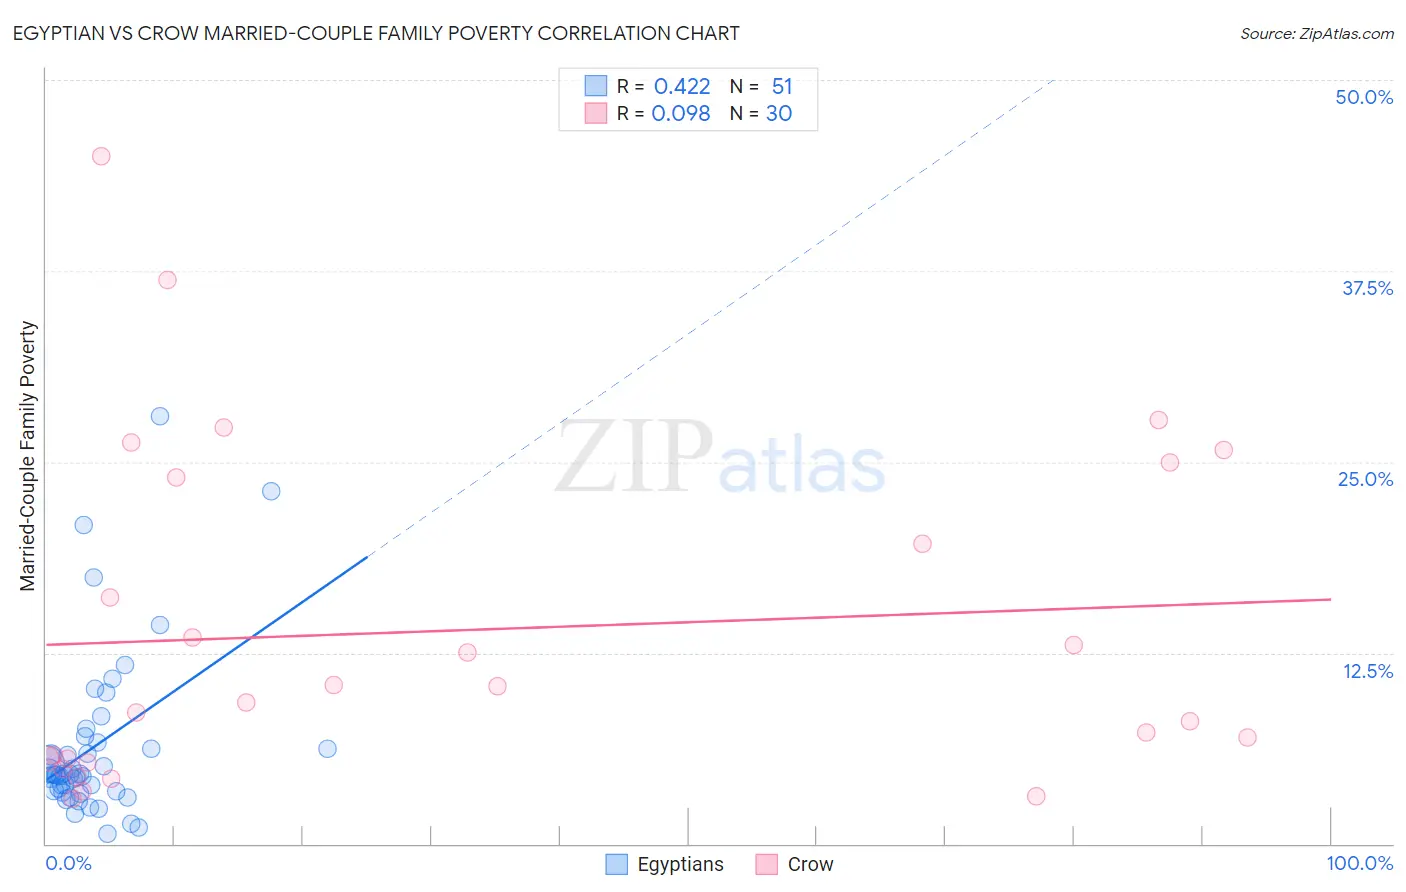
Egyptian vs Crow Married-Couple Family Poverty Correlation Chart
The statistical analysis conducted on geographies consisting of 275,471,686 people shows a moderate positive correlation between the proportion of Egyptians and poverty level among married-couple families in the United States with a correlation coefficient (R) of 0.422 and weighted average of 4.8%. Similarly, the statistical analysis conducted on geographies consisting of 59,050,450 people shows a slight positive correlation between the proportion of Crow and poverty level among married-couple families in the United States with a correlation coefficient (R) of 0.098 and weighted average of 9.6%, a difference of 97.2%.
Married-Couple Family Poverty Correlation Summary
| Measurement | Egyptian | Crow |
| Minimum | 0.67% | 2.9% |
| Maximum | 28.0% | 45.0% |
| Range | 27.3% | 42.1% |
| Mean | 6.4% | 14.0% |
| Median | 4.5% | 9.8% |
| Interquartile 25% (IQ1) | 3.4% | 5.6% |
| Interquartile 75% (IQ3) | 6.7% | 24.0% |
| Interquartile Range (IQR) | 3.2% | 18.4% |
| Standard Deviation (Sample) | 5.5% | 11.0% |
| Standard Deviation (Population) | 5.5% | 10.8% |
Similar Demographics by Married-Couple Family Poverty
Demographics Similar to Egyptians by Married-Couple Family Poverty
In terms of married-couple family poverty, the demographic groups most similar to Egyptians are Immigrants from Asia (4.8%, a difference of 0.14%), Immigrants from Bosnia and Herzegovina (4.8%, a difference of 0.21%), Romanian (4.8%, a difference of 0.23%), Palestinian (4.9%, a difference of 0.32%), and Jordanian (4.8%, a difference of 0.50%).
| Demographics | Rating | Rank | Married-Couple Family Poverty |
| Immigrants | Southern Europe | 93.4 /100 | #120 | Exceptional 4.8% |
| Indians (Asian) | 93.2 /100 | #121 | Exceptional 4.8% |
| Whites/Caucasians | 93.1 /100 | #122 | Exceptional 4.8% |
| Jordanians | 93.1 /100 | #123 | Exceptional 4.8% |
| Romanians | 92.5 /100 | #124 | Exceptional 4.8% |
| Immigrants | Bosnia and Herzegovina | 92.5 /100 | #125 | Exceptional 4.8% |
| Immigrants | Asia | 92.3 /100 | #126 | Exceptional 4.8% |
| Egyptians | 92.0 /100 | #127 | Exceptional 4.8% |
| Palestinians | 91.2 /100 | #128 | Exceptional 4.9% |
| Immigrants | Pakistan | 90.7 /100 | #129 | Exceptional 4.9% |
| Soviet Union | 90.7 /100 | #130 | Exceptional 4.9% |
| Immigrants | Eastern Europe | 90.5 /100 | #131 | Exceptional 4.9% |
| Puget Sound Salish | 90.4 /100 | #132 | Exceptional 4.9% |
| Immigrants | Kenya | 90.2 /100 | #133 | Exceptional 4.9% |
| Samoans | 90.2 /100 | #134 | Exceptional 4.9% |
Demographics Similar to Crow by Married-Couple Family Poverty
In terms of married-couple family poverty, the demographic groups most similar to Crow are Cheyenne (9.4%, a difference of 1.3%), Yuman (9.7%, a difference of 1.8%), Yakama (9.0%, a difference of 6.7%), Apache (9.0%, a difference of 6.8%), and Sioux (8.7%, a difference of 9.9%).
| Demographics | Rating | Rank | Married-Couple Family Poverty |
| Dominicans | 0.0 /100 | #332 | Tragic 8.3% |
| Lumbee | 0.0 /100 | #333 | Tragic 8.3% |
| Immigrants | Dominican Republic | 0.0 /100 | #334 | Tragic 8.4% |
| Sioux | 0.0 /100 | #335 | Tragic 8.7% |
| Apache | 0.0 /100 | #336 | Tragic 9.0% |
| Yakama | 0.0 /100 | #337 | Tragic 9.0% |
| Cheyenne | 0.0 /100 | #338 | Tragic 9.4% |
| Crow | 0.0 /100 | #339 | Tragic 9.6% |
| Yuman | 0.0 /100 | #340 | Tragic 9.7% |
| Pueblo | 0.0 /100 | #341 | Tragic 11.1% |
| Tohono O'odham | 0.0 /100 | #342 | Tragic 11.2% |
| Pima | 0.0 /100 | #343 | Tragic 11.4% |
| Navajo | 0.0 /100 | #344 | Tragic 11.9% |
| Puerto Ricans | 0.0 /100 | #345 | Tragic 12.6% |
| Immigrants | Yemen | 0.0 /100 | #346 | Tragic 12.8% |