Dutch West Indian vs Romanian Female Poverty
COMPARE
Dutch West Indian
Romanian
Female Poverty
Female Poverty Comparison
Dutch West Indians
Romanians
17.1%
FEMALE POVERTY
0.0/ 100
METRIC RATING
314th/ 347
METRIC RANK
12.5%
FEMALE POVERTY
95.1/ 100
METRIC RATING
99th/ 347
METRIC RANK
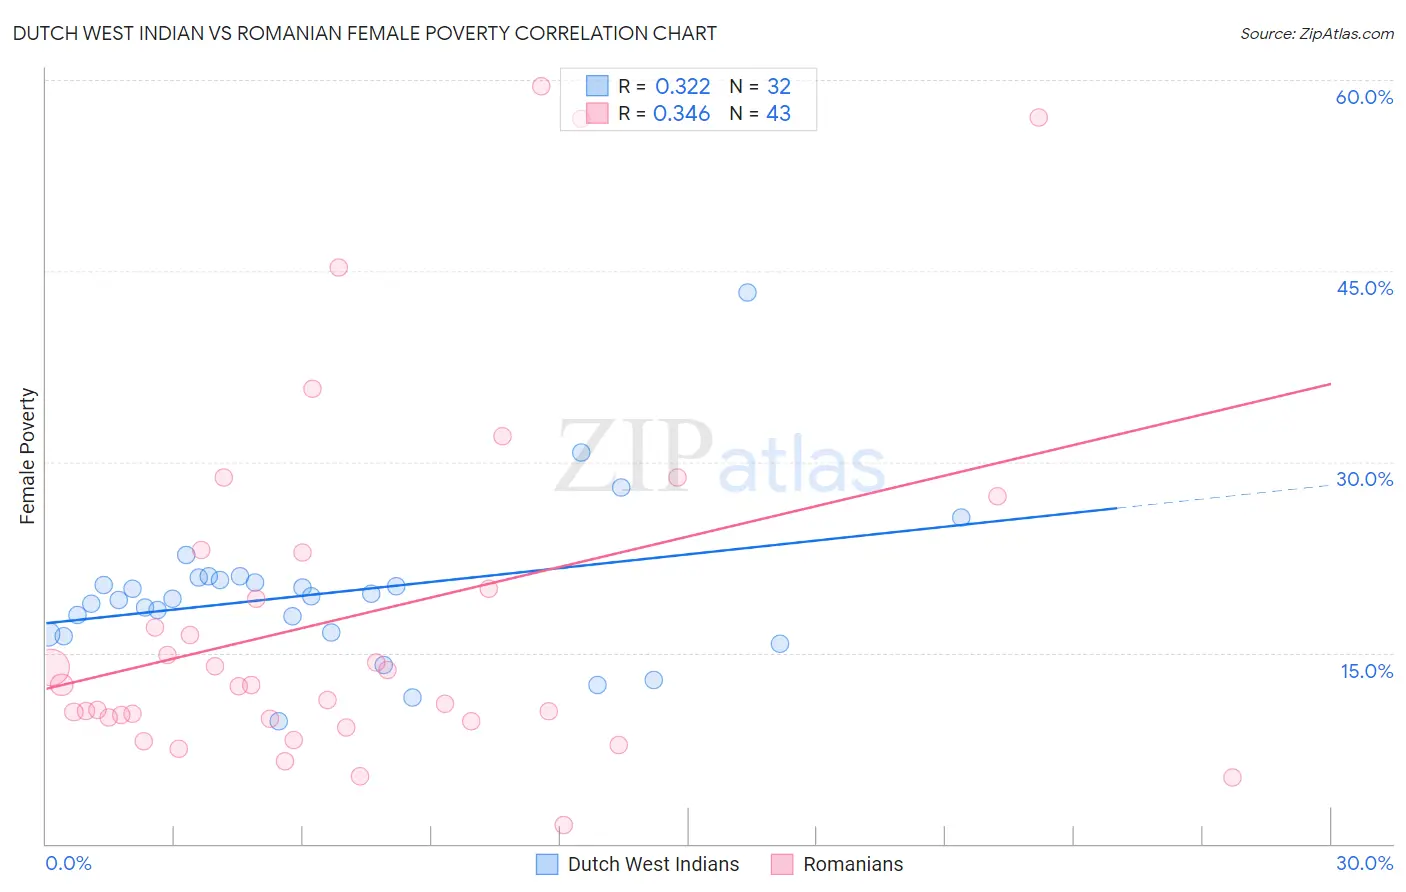
Dutch West Indian vs Romanian Female Poverty Correlation Chart
The statistical analysis conducted on geographies consisting of 85,761,145 people shows a mild positive correlation between the proportion of Dutch West Indians and poverty level among females in the United States with a correlation coefficient (R) of 0.322 and weighted average of 17.1%. Similarly, the statistical analysis conducted on geographies consisting of 377,651,231 people shows a mild positive correlation between the proportion of Romanians and poverty level among females in the United States with a correlation coefficient (R) of 0.346 and weighted average of 12.5%, a difference of 36.8%.
Female Poverty Correlation Summary
| Measurement | Dutch West Indian | Romanian |
| Minimum | 9.6% | 1.5% |
| Maximum | 43.3% | 59.5% |
| Range | 33.7% | 58.0% |
| Mean | 19.7% | 17.9% |
| Median | 19.3% | 12.5% |
| Interquartile 25% (IQ1) | 16.5% | 9.8% |
| Interquartile 75% (IQ3) | 20.8% | 22.9% |
| Interquartile Range (IQR) | 4.3% | 13.1% |
| Standard Deviation (Sample) | 6.1% | 14.2% |
| Standard Deviation (Population) | 6.0% | 14.0% |
Similar Demographics by Female Poverty
Demographics Similar to Dutch West Indians by Female Poverty
In terms of female poverty, the demographic groups most similar to Dutch West Indians are British West Indian (17.0%, a difference of 0.25%), Immigrants from Somalia (17.0%, a difference of 0.33%), Creek (17.0%, a difference of 0.42%), Immigrants from Guatemala (17.0%, a difference of 0.42%), and Immigrants from Mexico (17.0%, a difference of 0.67%).
| Demographics | Rating | Rank | Female Poverty |
| Seminole | 0.0 /100 | #307 | Tragic 16.9% |
| Africans | 0.0 /100 | #308 | Tragic 16.9% |
| Immigrants | Mexico | 0.0 /100 | #309 | Tragic 17.0% |
| Creek | 0.0 /100 | #310 | Tragic 17.0% |
| Immigrants | Guatemala | 0.0 /100 | #311 | Tragic 17.0% |
| Immigrants | Somalia | 0.0 /100 | #312 | Tragic 17.0% |
| British West Indians | 0.0 /100 | #313 | Tragic 17.0% |
| Dutch West Indians | 0.0 /100 | #314 | Tragic 17.1% |
| U.S. Virgin Islanders | 0.0 /100 | #315 | Tragic 17.3% |
| Hondurans | 0.0 /100 | #316 | Tragic 17.4% |
| Immigrants | Congo | 0.0 /100 | #317 | Tragic 17.4% |
| Ute | 0.0 /100 | #318 | Tragic 17.5% |
| Cajuns | 0.0 /100 | #319 | Tragic 17.5% |
| Immigrants | Dominica | 0.0 /100 | #320 | Tragic 17.5% |
| Arapaho | 0.0 /100 | #321 | Tragic 17.5% |
Demographics Similar to Romanians by Female Poverty
In terms of female poverty, the demographic groups most similar to Romanians are Native Hawaiian (12.5%, a difference of 0.020%), Australian (12.5%, a difference of 0.050%), British (12.5%, a difference of 0.070%), Immigrants from South Africa (12.5%, a difference of 0.15%), and Immigrants from Latvia (12.5%, a difference of 0.15%).
| Demographics | Rating | Rank | Female Poverty |
| Czechoslovakians | 95.7 /100 | #92 | Exceptional 12.4% |
| Immigrants | Egypt | 95.5 /100 | #93 | Exceptional 12.5% |
| Immigrants | Indonesia | 95.4 /100 | #94 | Exceptional 12.5% |
| Immigrants | South Africa | 95.4 /100 | #95 | Exceptional 12.5% |
| British | 95.2 /100 | #96 | Exceptional 12.5% |
| Australians | 95.2 /100 | #97 | Exceptional 12.5% |
| Native Hawaiians | 95.1 /100 | #98 | Exceptional 12.5% |
| Romanians | 95.1 /100 | #99 | Exceptional 12.5% |
| Immigrants | Latvia | 94.8 /100 | #100 | Exceptional 12.5% |
| Tlingit-Haida | 94.8 /100 | #101 | Exceptional 12.5% |
| Immigrants | China | 94.5 /100 | #102 | Exceptional 12.5% |
| Slavs | 94.5 /100 | #103 | Exceptional 12.5% |
| Palestinians | 94.3 /100 | #104 | Exceptional 12.5% |
| Scottish | 94.1 /100 | #105 | Exceptional 12.5% |
| Immigrants | Turkey | 93.8 /100 | #106 | Exceptional 12.6% |