Dutch West Indian vs Norwegian Female Poverty
COMPARE
Dutch West Indian
Norwegian
Female Poverty
Female Poverty Comparison
Dutch West Indians
Norwegians
17.1%
FEMALE POVERTY
0.0/ 100
METRIC RATING
314th/ 347
METRIC RANK
11.5%
FEMALE POVERTY
99.8/ 100
METRIC RATING
19th/ 347
METRIC RANK
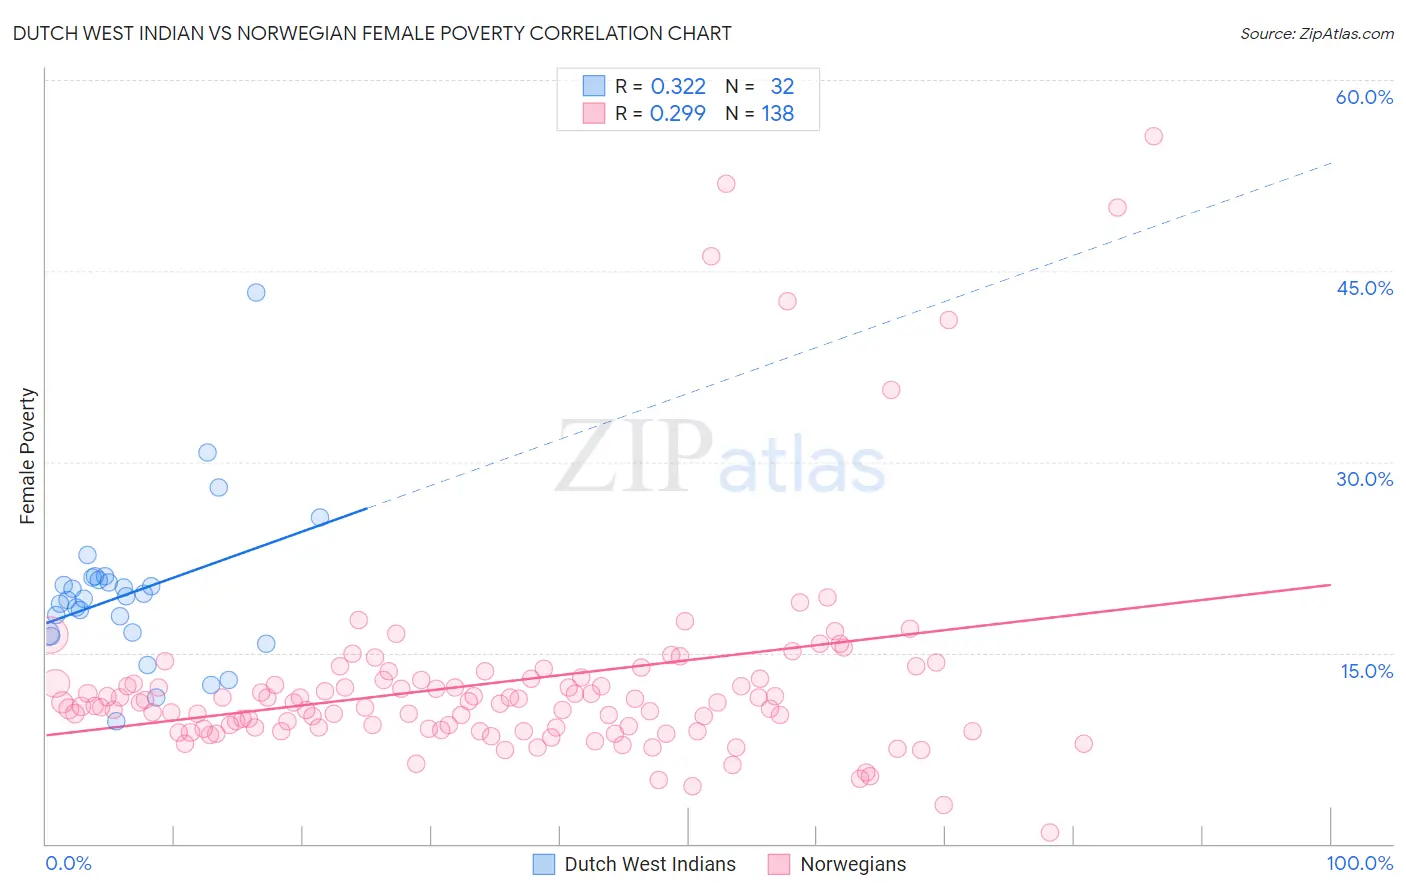
Dutch West Indian vs Norwegian Female Poverty Correlation Chart
The statistical analysis conducted on geographies consisting of 85,761,145 people shows a mild positive correlation between the proportion of Dutch West Indians and poverty level among females in the United States with a correlation coefficient (R) of 0.322 and weighted average of 17.1%. Similarly, the statistical analysis conducted on geographies consisting of 532,481,223 people shows a weak positive correlation between the proportion of Norwegians and poverty level among females in the United States with a correlation coefficient (R) of 0.299 and weighted average of 11.5%, a difference of 48.4%.
Female Poverty Correlation Summary
| Measurement | Dutch West Indian | Norwegian |
| Minimum | 9.6% | 0.92% |
| Maximum | 43.3% | 55.6% |
| Range | 33.7% | 54.6% |
| Mean | 19.7% | 12.7% |
| Median | 19.3% | 11.1% |
| Interquartile 25% (IQ1) | 16.5% | 9.0% |
| Interquartile 75% (IQ3) | 20.8% | 12.9% |
| Interquartile Range (IQR) | 4.3% | 3.8% |
| Standard Deviation (Sample) | 6.1% | 8.4% |
| Standard Deviation (Population) | 6.0% | 8.4% |
Similar Demographics by Female Poverty
Demographics Similar to Dutch West Indians by Female Poverty
In terms of female poverty, the demographic groups most similar to Dutch West Indians are British West Indian (17.0%, a difference of 0.25%), Immigrants from Somalia (17.0%, a difference of 0.33%), Creek (17.0%, a difference of 0.42%), Immigrants from Guatemala (17.0%, a difference of 0.42%), and Immigrants from Mexico (17.0%, a difference of 0.67%).
| Demographics | Rating | Rank | Female Poverty |
| Seminole | 0.0 /100 | #307 | Tragic 16.9% |
| Africans | 0.0 /100 | #308 | Tragic 16.9% |
| Immigrants | Mexico | 0.0 /100 | #309 | Tragic 17.0% |
| Creek | 0.0 /100 | #310 | Tragic 17.0% |
| Immigrants | Guatemala | 0.0 /100 | #311 | Tragic 17.0% |
| Immigrants | Somalia | 0.0 /100 | #312 | Tragic 17.0% |
| British West Indians | 0.0 /100 | #313 | Tragic 17.0% |
| Dutch West Indians | 0.0 /100 | #314 | Tragic 17.1% |
| U.S. Virgin Islanders | 0.0 /100 | #315 | Tragic 17.3% |
| Hondurans | 0.0 /100 | #316 | Tragic 17.4% |
| Immigrants | Congo | 0.0 /100 | #317 | Tragic 17.4% |
| Ute | 0.0 /100 | #318 | Tragic 17.5% |
| Cajuns | 0.0 /100 | #319 | Tragic 17.5% |
| Immigrants | Dominica | 0.0 /100 | #320 | Tragic 17.5% |
| Arapaho | 0.0 /100 | #321 | Tragic 17.5% |
Demographics Similar to Norwegians by Female Poverty
In terms of female poverty, the demographic groups most similar to Norwegians are Immigrants from Scotland (11.5%, a difference of 0.040%), Bolivian (11.5%, a difference of 0.090%), Immigrants from Bolivia (11.5%, a difference of 0.16%), Eastern European (11.5%, a difference of 0.23%), and Latvian (11.4%, a difference of 0.64%).
| Demographics | Rating | Rank | Female Poverty |
| Bhutanese | 99.9 /100 | #12 | Exceptional 11.3% |
| Immigrants | Lithuania | 99.9 /100 | #13 | Exceptional 11.3% |
| Lithuanians | 99.8 /100 | #14 | Exceptional 11.4% |
| Latvians | 99.8 /100 | #15 | Exceptional 11.4% |
| Immigrants | Bolivia | 99.8 /100 | #16 | Exceptional 11.5% |
| Bolivians | 99.8 /100 | #17 | Exceptional 11.5% |
| Immigrants | Scotland | 99.8 /100 | #18 | Exceptional 11.5% |
| Norwegians | 99.8 /100 | #19 | Exceptional 11.5% |
| Eastern Europeans | 99.7 /100 | #20 | Exceptional 11.5% |
| Italians | 99.7 /100 | #21 | Exceptional 11.6% |
| Swedes | 99.7 /100 | #22 | Exceptional 11.6% |
| Burmese | 99.7 /100 | #23 | Exceptional 11.6% |
| Luxembourgers | 99.7 /100 | #24 | Exceptional 11.6% |
| Immigrants | Northern Europe | 99.6 /100 | #25 | Exceptional 11.6% |
| Croatians | 99.6 /100 | #26 | Exceptional 11.6% |