Dutch vs Black/African American Single Father Poverty
COMPARE
Dutch
Black/African American
Single Father Poverty
Single Father Poverty Comparison
Dutch
Blacks/African Americans
17.8%
SINGLE FATHER POVERTY
0.0/ 100
METRIC RATING
282nd/ 347
METRIC RANK
20.4%
SINGLE FATHER POVERTY
0.0/ 100
METRIC RATING
325th/ 347
METRIC RANK
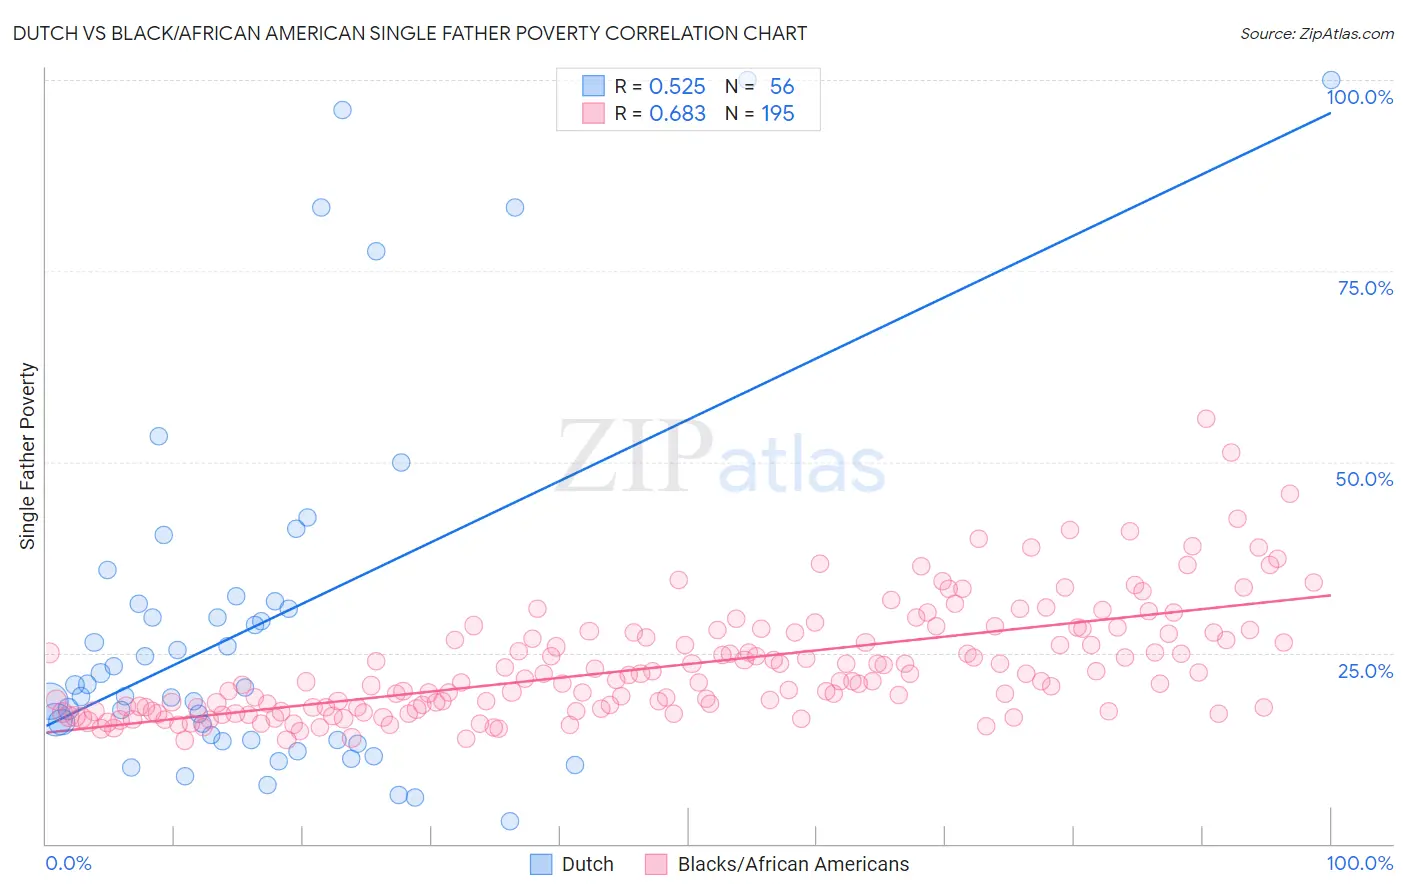
Dutch vs Black/African American Single Father Poverty Correlation Chart
The statistical analysis conducted on geographies consisting of 399,453,553 people shows a substantial positive correlation between the proportion of Dutch and poverty level among single fathers in the United States with a correlation coefficient (R) of 0.525 and weighted average of 17.8%. Similarly, the statistical analysis conducted on geographies consisting of 410,273,271 people shows a significant positive correlation between the proportion of Blacks/African Americans and poverty level among single fathers in the United States with a correlation coefficient (R) of 0.683 and weighted average of 20.4%, a difference of 14.5%.
Single Father Poverty Correlation Summary
| Measurement | Dutch | Black/African American |
| Minimum | 2.9% | 13.5% |
| Maximum | 100.0% | 55.6% |
| Range | 97.1% | 42.1% |
| Mean | 28.9% | 23.3% |
| Median | 20.7% | 21.3% |
| Interquartile 25% (IQ1) | 13.6% | 17.6% |
| Interquartile 75% (IQ3) | 31.6% | 27.7% |
| Interquartile Range (IQR) | 18.0% | 10.1% |
| Standard Deviation (Sample) | 24.1% | 7.4% |
| Standard Deviation (Population) | 23.9% | 7.4% |
Similar Demographics by Single Father Poverty
Demographics Similar to Dutch by Single Father Poverty
In terms of single father poverty, the demographic groups most similar to Dutch are English (17.8%, a difference of 0.0%), Alsatian (17.8%, a difference of 0.10%), Welsh (17.8%, a difference of 0.11%), Scottish (17.7%, a difference of 0.32%), and Iroquois (17.7%, a difference of 0.37%).
| Demographics | Rating | Rank | Single Father Poverty |
| British West Indians | 0.0 /100 | #275 | Tragic 17.7% |
| German Russians | 0.0 /100 | #276 | Tragic 17.7% |
| Lebanese | 0.0 /100 | #277 | Tragic 17.7% |
| Germans | 0.0 /100 | #278 | Tragic 17.7% |
| Iroquois | 0.0 /100 | #279 | Tragic 17.7% |
| Scottish | 0.0 /100 | #280 | Tragic 17.7% |
| English | 0.0 /100 | #281 | Tragic 17.8% |
| Dutch | 0.0 /100 | #282 | Tragic 17.8% |
| Alsatians | 0.0 /100 | #283 | Tragic 17.8% |
| Welsh | 0.0 /100 | #284 | Tragic 17.8% |
| Immigrants | Lebanon | 0.0 /100 | #285 | Tragic 17.9% |
| Immigrants | North Macedonia | 0.0 /100 | #286 | Tragic 17.9% |
| Carpatho Rusyns | 0.0 /100 | #287 | Tragic 18.0% |
| Bahamians | 0.0 /100 | #288 | Tragic 18.0% |
| Irish | 0.0 /100 | #289 | Tragic 18.0% |
Demographics Similar to Blacks/African Americans by Single Father Poverty
In terms of single father poverty, the demographic groups most similar to Blacks/African Americans are Immigrants from Yemen (20.6%, a difference of 1.0%), American (20.1%, a difference of 1.6%), Choctaw (20.7%, a difference of 1.7%), Pennsylvania German (20.0%, a difference of 1.8%), and Creek (19.8%, a difference of 2.7%).
| Demographics | Rating | Rank | Single Father Poverty |
| Dutch West Indians | 0.0 /100 | #318 | Tragic 19.2% |
| Slovaks | 0.0 /100 | #319 | Tragic 19.3% |
| Inupiat | 0.0 /100 | #320 | Tragic 19.5% |
| Cherokee | 0.0 /100 | #321 | Tragic 19.6% |
| Creek | 0.0 /100 | #322 | Tragic 19.8% |
| Pennsylvania Germans | 0.0 /100 | #323 | Tragic 20.0% |
| Americans | 0.0 /100 | #324 | Tragic 20.1% |
| Blacks/African Americans | 0.0 /100 | #325 | Tragic 20.4% |
| Immigrants | Yemen | 0.0 /100 | #326 | Tragic 20.6% |
| Choctaw | 0.0 /100 | #327 | Tragic 20.7% |
| Pueblo | 0.0 /100 | #328 | Tragic 21.1% |
| Colville | 0.0 /100 | #329 | Tragic 21.4% |
| Paiute | 0.0 /100 | #330 | Tragic 21.6% |
| Central American Indians | 0.0 /100 | #331 | Tragic 21.7% |
| Tohono O'odham | 0.0 /100 | #332 | Tragic 22.0% |