Dutch vs Immigrants from Dominica Single Father Poverty
COMPARE
Dutch
Immigrants from Dominica
Single Father Poverty
Single Father Poverty Comparison
Dutch
Immigrants from Dominica
17.8%
SINGLE FATHER POVERTY
0.0/ 100
METRIC RATING
282nd/ 347
METRIC RANK
18.9%
SINGLE FATHER POVERTY
0.0/ 100
METRIC RATING
312th/ 347
METRIC RANK
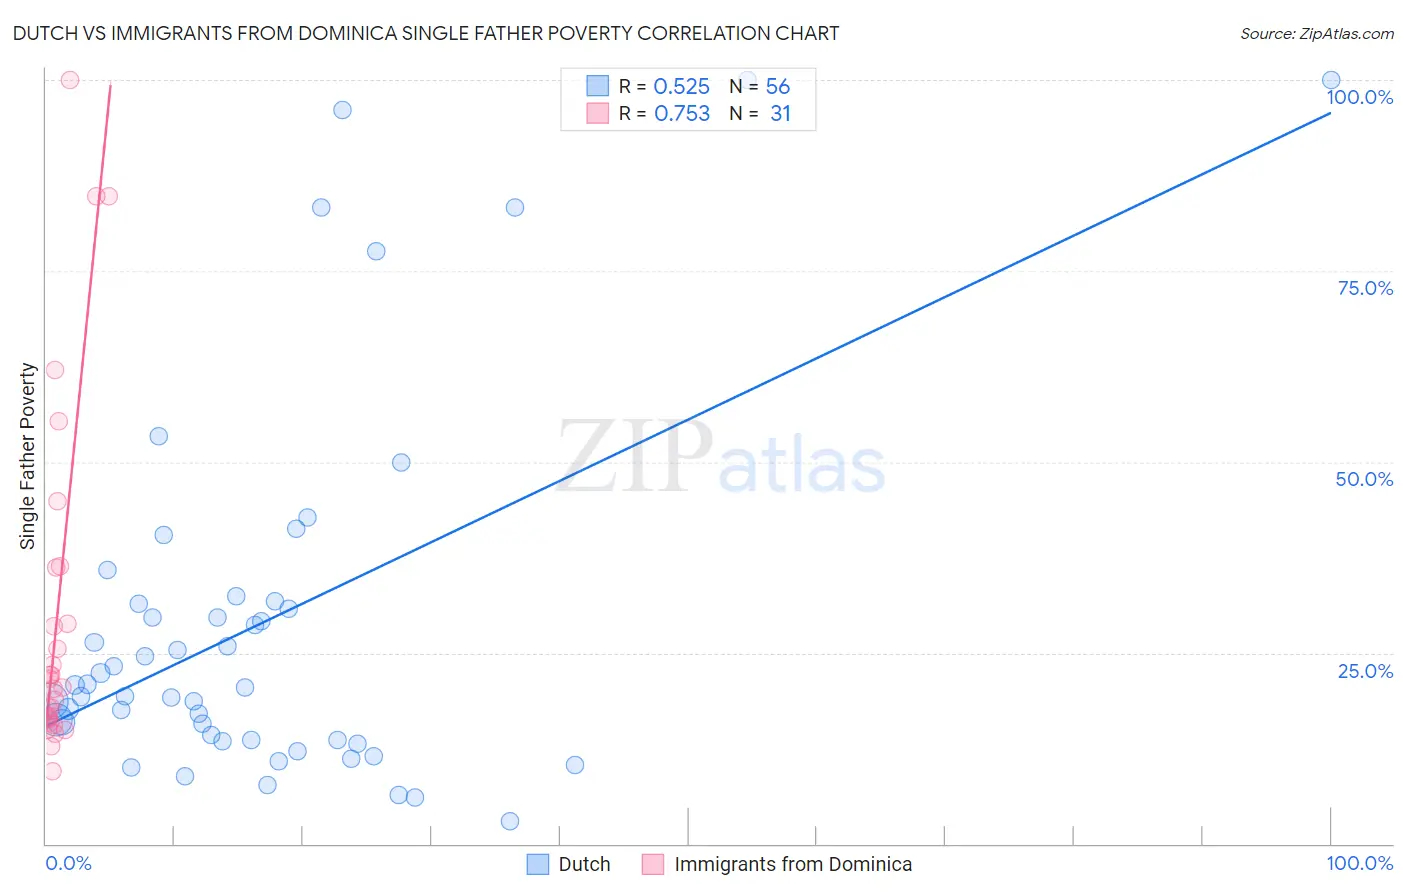
Dutch vs Immigrants from Dominica Single Father Poverty Correlation Chart
The statistical analysis conducted on geographies consisting of 399,453,553 people shows a substantial positive correlation between the proportion of Dutch and poverty level among single fathers in the United States with a correlation coefficient (R) of 0.525 and weighted average of 17.8%. Similarly, the statistical analysis conducted on geographies consisting of 78,251,177 people shows a strong positive correlation between the proportion of Immigrants from Dominica and poverty level among single fathers in the United States with a correlation coefficient (R) of 0.753 and weighted average of 18.9%, a difference of 5.9%.
Single Father Poverty Correlation Summary
| Measurement | Dutch | Immigrants from Dominica |
| Minimum | 2.9% | 9.4% |
| Maximum | 100.0% | 100.0% |
| Range | 97.1% | 90.6% |
| Mean | 28.9% | 30.2% |
| Median | 20.7% | 20.5% |
| Interquartile 25% (IQ1) | 13.6% | 16.4% |
| Interquartile 75% (IQ3) | 31.6% | 36.1% |
| Interquartile Range (IQR) | 18.0% | 19.7% |
| Standard Deviation (Sample) | 24.1% | 23.3% |
| Standard Deviation (Population) | 23.9% | 22.9% |
Similar Demographics by Single Father Poverty
Demographics Similar to Dutch by Single Father Poverty
In terms of single father poverty, the demographic groups most similar to Dutch are English (17.8%, a difference of 0.0%), Alsatian (17.8%, a difference of 0.10%), Welsh (17.8%, a difference of 0.11%), Scottish (17.7%, a difference of 0.32%), and Iroquois (17.7%, a difference of 0.37%).
| Demographics | Rating | Rank | Single Father Poverty |
| British West Indians | 0.0 /100 | #275 | Tragic 17.7% |
| German Russians | 0.0 /100 | #276 | Tragic 17.7% |
| Lebanese | 0.0 /100 | #277 | Tragic 17.7% |
| Germans | 0.0 /100 | #278 | Tragic 17.7% |
| Iroquois | 0.0 /100 | #279 | Tragic 17.7% |
| Scottish | 0.0 /100 | #280 | Tragic 17.7% |
| English | 0.0 /100 | #281 | Tragic 17.8% |
| Dutch | 0.0 /100 | #282 | Tragic 17.8% |
| Alsatians | 0.0 /100 | #283 | Tragic 17.8% |
| Welsh | 0.0 /100 | #284 | Tragic 17.8% |
| Immigrants | Lebanon | 0.0 /100 | #285 | Tragic 17.9% |
| Immigrants | North Macedonia | 0.0 /100 | #286 | Tragic 17.9% |
| Carpatho Rusyns | 0.0 /100 | #287 | Tragic 18.0% |
| Bahamians | 0.0 /100 | #288 | Tragic 18.0% |
| Irish | 0.0 /100 | #289 | Tragic 18.0% |
Demographics Similar to Immigrants from Dominica by Single Father Poverty
In terms of single father poverty, the demographic groups most similar to Immigrants from Dominica are Nonimmigrants (18.8%, a difference of 0.050%), Potawatomi (18.9%, a difference of 0.20%), Chippewa (18.8%, a difference of 0.24%), Delaware (18.9%, a difference of 0.36%), and Chickasaw (19.0%, a difference of 0.52%).
| Demographics | Rating | Rank | Single Father Poverty |
| Blackfeet | 0.0 /100 | #305 | Tragic 18.5% |
| Scotch-Irish | 0.0 /100 | #306 | Tragic 18.6% |
| French Canadians | 0.0 /100 | #307 | Tragic 18.6% |
| Ottawa | 0.0 /100 | #308 | Tragic 18.6% |
| Immigrants | Micronesia | 0.0 /100 | #309 | Tragic 18.6% |
| Chippewa | 0.0 /100 | #310 | Tragic 18.8% |
| Immigrants | Nonimmigrants | 0.0 /100 | #311 | Tragic 18.8% |
| Immigrants | Dominica | 0.0 /100 | #312 | Tragic 18.9% |
| Potawatomi | 0.0 /100 | #313 | Tragic 18.9% |
| Delaware | 0.0 /100 | #314 | Tragic 18.9% |
| Chickasaw | 0.0 /100 | #315 | Tragic 19.0% |
| Osage | 0.0 /100 | #316 | Tragic 19.0% |
| Dominicans | 0.0 /100 | #317 | Tragic 19.1% |
| Dutch West Indians | 0.0 /100 | #318 | Tragic 19.2% |
| Slovaks | 0.0 /100 | #319 | Tragic 19.3% |