Dutch vs Lithuanian Single Father Poverty
COMPARE
Dutch
Lithuanian
Single Father Poverty
Single Father Poverty Comparison
Dutch
Lithuanians
17.8%
SINGLE FATHER POVERTY
0.0/ 100
METRIC RATING
282nd/ 347
METRIC RANK
17.3%
SINGLE FATHER POVERTY
0.4/ 100
METRIC RATING
263rd/ 347
METRIC RANK
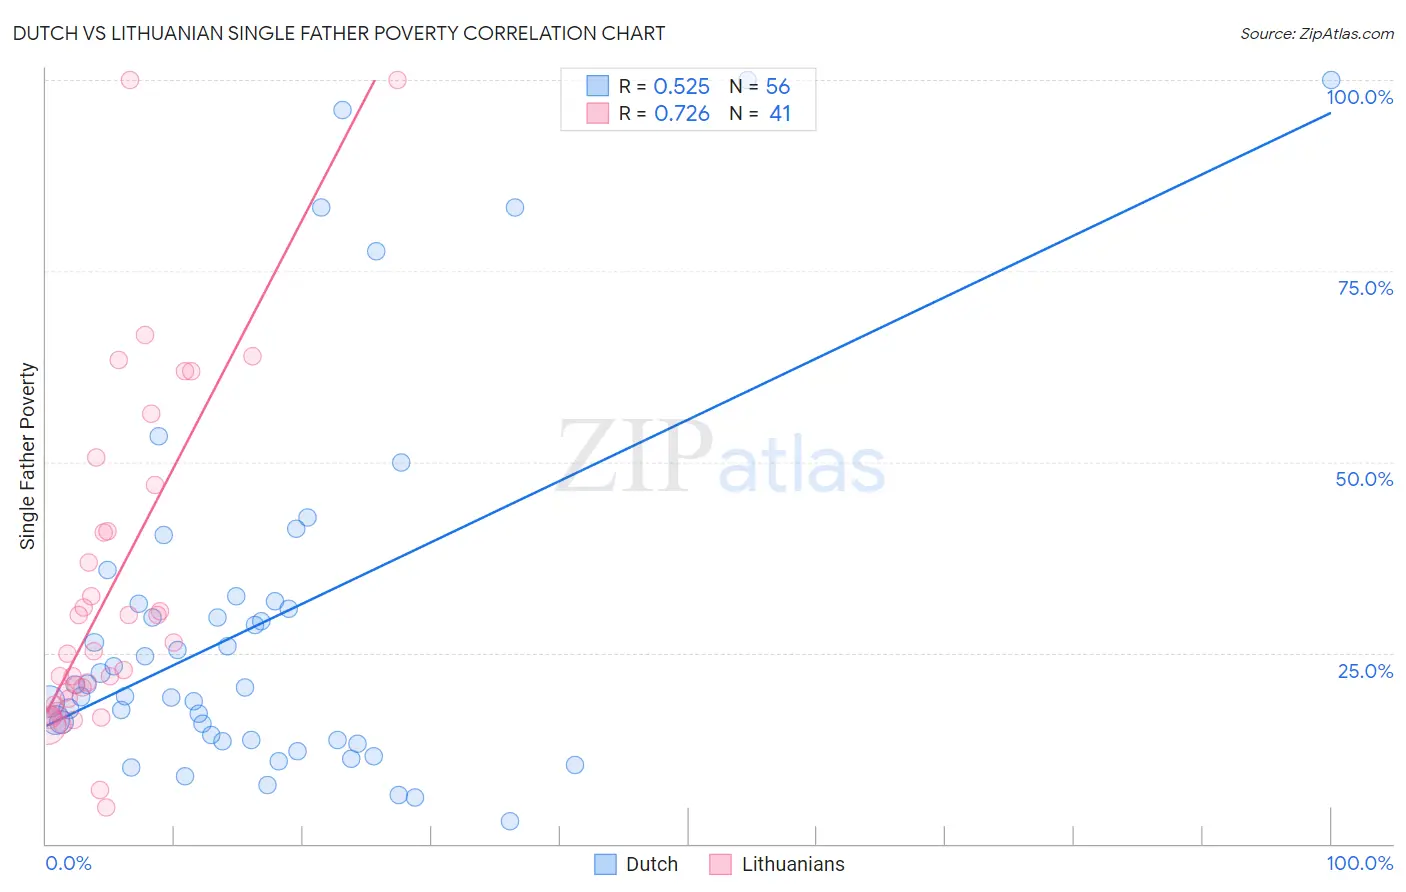
Dutch vs Lithuanian Single Father Poverty Correlation Chart
The statistical analysis conducted on geographies consisting of 399,453,553 people shows a substantial positive correlation between the proportion of Dutch and poverty level among single fathers in the United States with a correlation coefficient (R) of 0.525 and weighted average of 17.8%. Similarly, the statistical analysis conducted on geographies consisting of 319,660,804 people shows a strong positive correlation between the proportion of Lithuanians and poverty level among single fathers in the United States with a correlation coefficient (R) of 0.726 and weighted average of 17.3%, a difference of 3.0%.
Single Father Poverty Correlation Summary
| Measurement | Dutch | Lithuanian |
| Minimum | 2.9% | 4.8% |
| Maximum | 100.0% | 100.0% |
| Range | 97.1% | 95.2% |
| Mean | 28.9% | 33.8% |
| Median | 20.7% | 25.2% |
| Interquartile 25% (IQ1) | 13.6% | 18.5% |
| Interquartile 75% (IQ3) | 31.6% | 44.0% |
| Interquartile Range (IQR) | 18.0% | 25.5% |
| Standard Deviation (Sample) | 24.1% | 22.3% |
| Standard Deviation (Population) | 23.9% | 22.1% |
Demographics Similar to Dutch and Lithuanians by Single Father Poverty
In terms of single father poverty, the demographic groups most similar to Dutch are English (17.8%, a difference of 0.0%), Scottish (17.7%, a difference of 0.32%), Iroquois (17.7%, a difference of 0.37%), German (17.7%, a difference of 0.51%), and Lebanese (17.7%, a difference of 0.52%). Similarly, the demographic groups most similar to Lithuanians are Immigrants from Zaire (17.3%, a difference of 0.010%), Slovene (17.3%, a difference of 0.20%), Polish (17.3%, a difference of 0.21%), Jamaican (17.3%, a difference of 0.26%), and Haitian (17.3%, a difference of 0.30%).
| Demographics | Rating | Rank | Single Father Poverty |
| Immigrants | Zaire | 0.4 /100 | #262 | Tragic 17.3% |
| Lithuanians | 0.4 /100 | #263 | Tragic 17.3% |
| Slovenes | 0.3 /100 | #264 | Tragic 17.3% |
| Poles | 0.3 /100 | #265 | Tragic 17.3% |
| Jamaicans | 0.3 /100 | #266 | Tragic 17.3% |
| Haitians | 0.3 /100 | #267 | Tragic 17.3% |
| Immigrants | Caribbean | 0.3 /100 | #268 | Tragic 17.4% |
| Slavs | 0.3 /100 | #269 | Tragic 17.4% |
| Indonesians | 0.2 /100 | #270 | Tragic 17.4% |
| French American Indians | 0.2 /100 | #271 | Tragic 17.4% |
| Barbadians | 0.1 /100 | #272 | Tragic 17.5% |
| Italians | 0.1 /100 | #273 | Tragic 17.5% |
| Macedonians | 0.1 /100 | #274 | Tragic 17.7% |
| British West Indians | 0.0 /100 | #275 | Tragic 17.7% |
| German Russians | 0.0 /100 | #276 | Tragic 17.7% |
| Lebanese | 0.0 /100 | #277 | Tragic 17.7% |
| Germans | 0.0 /100 | #278 | Tragic 17.7% |
| Iroquois | 0.0 /100 | #279 | Tragic 17.7% |
| Scottish | 0.0 /100 | #280 | Tragic 17.7% |
| English | 0.0 /100 | #281 | Tragic 17.8% |
| Dutch | 0.0 /100 | #282 | Tragic 17.8% |