Delaware vs Bermudan Male Poverty
COMPARE
Delaware
Bermudan
Male Poverty
Male Poverty Comparison
Delaware
Bermudans
11.7%
MALE POVERTY
15.4/ 100
METRIC RATING
197th/ 347
METRIC RANK
12.2%
MALE POVERTY
2.4/ 100
METRIC RATING
219th/ 347
METRIC RANK
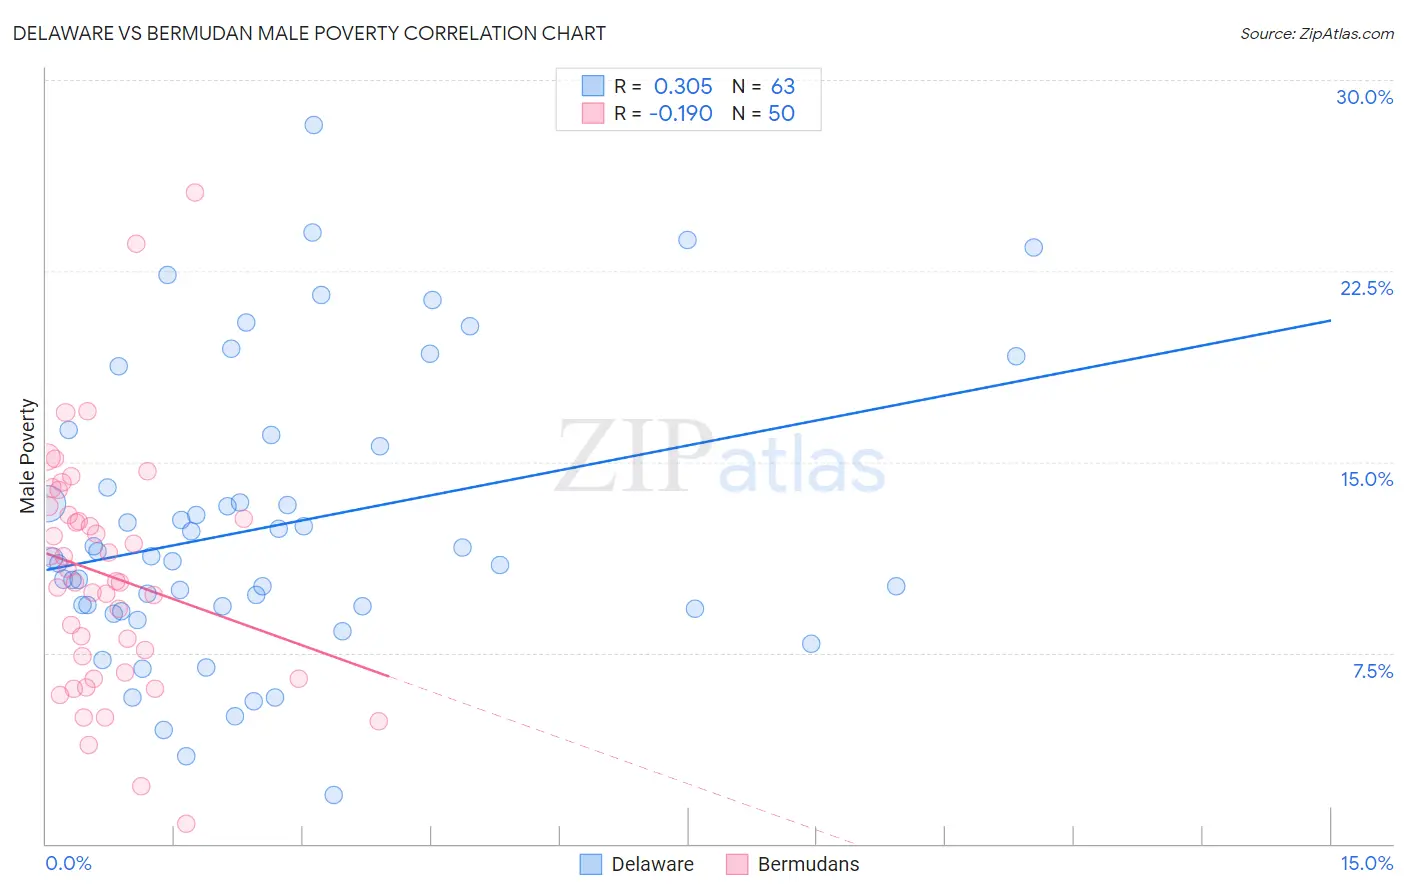
Delaware vs Bermudan Male Poverty Correlation Chart
The statistical analysis conducted on geographies consisting of 96,214,887 people shows a mild positive correlation between the proportion of Delaware and poverty level among males in the United States with a correlation coefficient (R) of 0.305 and weighted average of 11.7%. Similarly, the statistical analysis conducted on geographies consisting of 55,715,607 people shows a poor negative correlation between the proportion of Bermudans and poverty level among males in the United States with a correlation coefficient (R) of -0.190 and weighted average of 12.2%, a difference of 4.7%.
Male Poverty Correlation Summary
| Measurement | Delaware | Bermudan |
| Minimum | 1.9% | 0.81% |
| Maximum | 28.2% | 25.6% |
| Range | 26.3% | 24.8% |
| Mean | 12.5% | 10.5% |
| Median | 11.2% | 10.3% |
| Interquartile 25% (IQ1) | 9.2% | 6.7% |
| Interquartile 75% (IQ3) | 15.6% | 12.9% |
| Interquartile Range (IQR) | 6.4% | 6.2% |
| Standard Deviation (Sample) | 5.6% | 4.7% |
| Standard Deviation (Population) | 5.6% | 4.7% |
Similar Demographics by Male Poverty
Demographics Similar to Delaware by Male Poverty
In terms of male poverty, the demographic groups most similar to Delaware are Hmong (11.6%, a difference of 0.060%), Arab (11.6%, a difference of 0.070%), Immigrants from Kenya (11.6%, a difference of 0.12%), Iraqi (11.7%, a difference of 0.14%), and Spanish (11.7%, a difference of 0.24%).
| Demographics | Rating | Rank | Male Poverty |
| Israelis | 26.1 /100 | #190 | Fair 11.5% |
| South American Indians | 22.8 /100 | #191 | Fair 11.5% |
| Immigrants | Uruguay | 19.1 /100 | #192 | Poor 11.6% |
| Immigrants | Kuwait | 17.3 /100 | #193 | Poor 11.6% |
| Immigrants | Kenya | 16.1 /100 | #194 | Poor 11.6% |
| Arabs | 15.8 /100 | #195 | Poor 11.6% |
| Hmong | 15.8 /100 | #196 | Poor 11.6% |
| Delaware | 15.4 /100 | #197 | Poor 11.7% |
| Iraqis | 14.7 /100 | #198 | Poor 11.7% |
| Spanish | 14.1 /100 | #199 | Poor 11.7% |
| Immigrants | Lebanon | 13.6 /100 | #200 | Poor 11.7% |
| Spaniards | 13.5 /100 | #201 | Poor 11.7% |
| Aleuts | 10.4 /100 | #202 | Poor 11.8% |
| Immigrants | Western Asia | 9.8 /100 | #203 | Tragic 11.8% |
| Immigrants | Uganda | 8.5 /100 | #204 | Tragic 11.8% |
Demographics Similar to Bermudans by Male Poverty
In terms of male poverty, the demographic groups most similar to Bermudans are Immigrants from Eritrea (12.2%, a difference of 0.020%), German Russian (12.2%, a difference of 0.070%), Immigrants from Thailand (12.2%, a difference of 0.090%), Immigrants from Cambodia (12.2%, a difference of 0.10%), and Immigrants from Uzbekistan (12.2%, a difference of 0.18%).
| Demographics | Rating | Rank | Male Poverty |
| Americans | 3.2 /100 | #212 | Tragic 12.1% |
| Immigrants | Nonimmigrants | 3.1 /100 | #213 | Tragic 12.1% |
| Japanese | 2.7 /100 | #214 | Tragic 12.2% |
| Immigrants | Uzbekistan | 2.6 /100 | #215 | Tragic 12.2% |
| Immigrants | Cambodia | 2.5 /100 | #216 | Tragic 12.2% |
| Immigrants | Thailand | 2.5 /100 | #217 | Tragic 12.2% |
| German Russians | 2.5 /100 | #218 | Tragic 12.2% |
| Bermudans | 2.4 /100 | #219 | Tragic 12.2% |
| Immigrants | Eritrea | 2.4 /100 | #220 | Tragic 12.2% |
| Ugandans | 2.2 /100 | #221 | Tragic 12.2% |
| Immigrants | Africa | 2.1 /100 | #222 | Tragic 12.2% |
| Immigrants | Micronesia | 2.1 /100 | #223 | Tragic 12.2% |
| Immigrants | Nigeria | 1.6 /100 | #224 | Tragic 12.3% |
| Osage | 1.5 /100 | #225 | Tragic 12.3% |
| Nigerians | 1.4 /100 | #226 | Tragic 12.3% |