Delaware vs Immigrants from Philippines Male Poverty
COMPARE
Delaware
Immigrants from Philippines
Male Poverty
Male Poverty Comparison
Delaware
Immigrants from Philippines
11.7%
MALE POVERTY
15.4/ 100
METRIC RATING
197th/ 347
METRIC RANK
10.0%
MALE POVERTY
98.7/ 100
METRIC RATING
50th/ 347
METRIC RANK
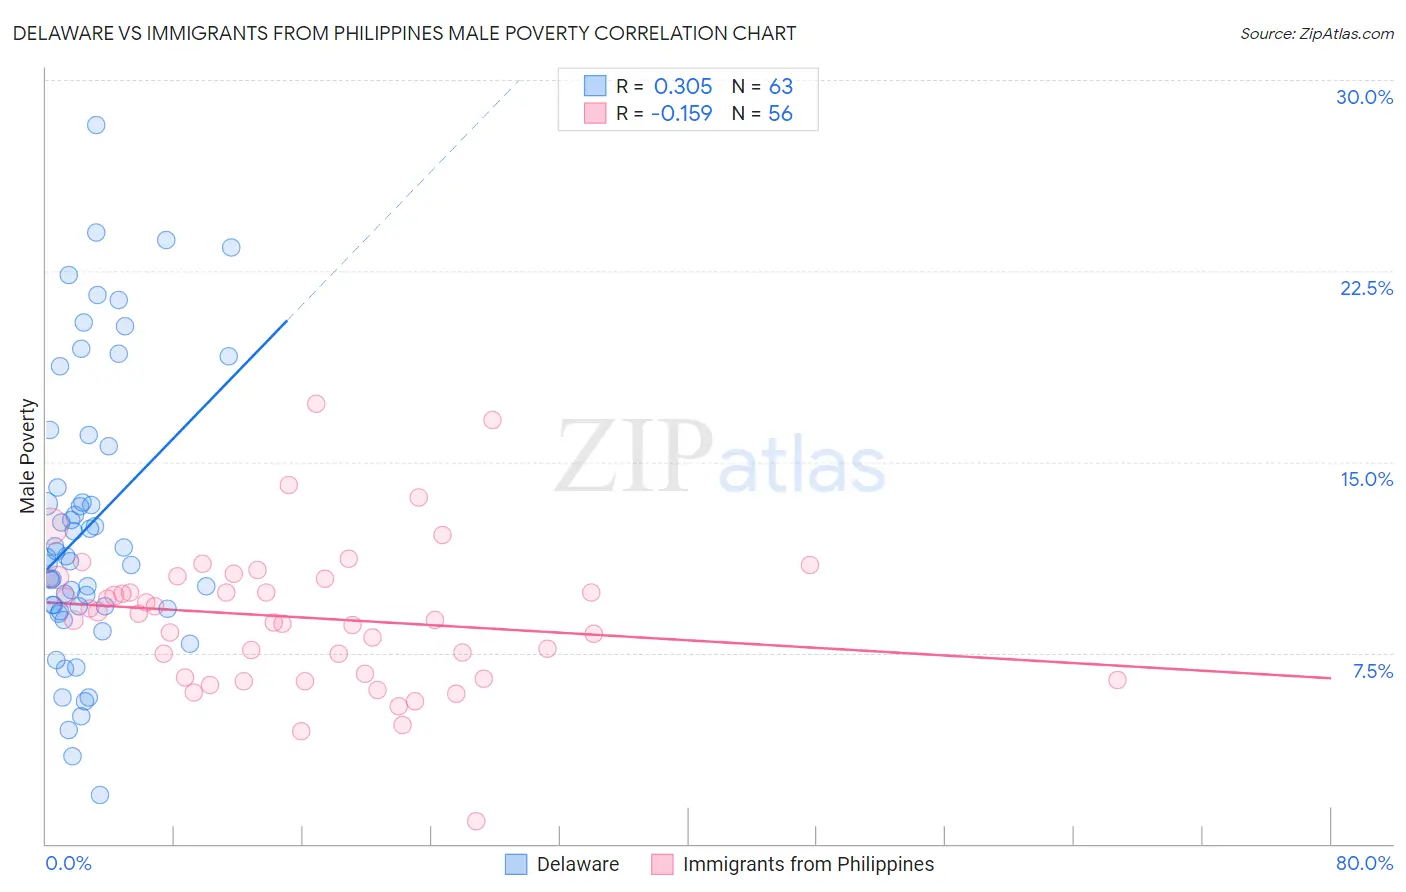
Delaware vs Immigrants from Philippines Male Poverty Correlation Chart
The statistical analysis conducted on geographies consisting of 96,214,887 people shows a mild positive correlation between the proportion of Delaware and poverty level among males in the United States with a correlation coefficient (R) of 0.305 and weighted average of 11.7%. Similarly, the statistical analysis conducted on geographies consisting of 470,810,616 people shows a poor negative correlation between the proportion of Immigrants from Philippines and poverty level among males in the United States with a correlation coefficient (R) of -0.159 and weighted average of 10.0%, a difference of 16.6%.
Male Poverty Correlation Summary
| Measurement | Delaware | Immigrants from Philippines |
| Minimum | 1.9% | 0.87% |
| Maximum | 28.2% | 17.3% |
| Range | 26.3% | 16.4% |
| Mean | 12.5% | 8.9% |
| Median | 11.2% | 8.9% |
| Interquartile 25% (IQ1) | 9.2% | 6.6% |
| Interquartile 75% (IQ3) | 15.6% | 10.4% |
| Interquartile Range (IQR) | 6.4% | 3.8% |
| Standard Deviation (Sample) | 5.6% | 2.8% |
| Standard Deviation (Population) | 5.6% | 2.8% |
Similar Demographics by Male Poverty
Demographics Similar to Delaware by Male Poverty
In terms of male poverty, the demographic groups most similar to Delaware are Hmong (11.6%, a difference of 0.060%), Arab (11.6%, a difference of 0.070%), Immigrants from Kenya (11.6%, a difference of 0.12%), Iraqi (11.7%, a difference of 0.14%), and Spanish (11.7%, a difference of 0.24%).
| Demographics | Rating | Rank | Male Poverty |
| Israelis | 26.1 /100 | #190 | Fair 11.5% |
| South American Indians | 22.8 /100 | #191 | Fair 11.5% |
| Immigrants | Uruguay | 19.1 /100 | #192 | Poor 11.6% |
| Immigrants | Kuwait | 17.3 /100 | #193 | Poor 11.6% |
| Immigrants | Kenya | 16.1 /100 | #194 | Poor 11.6% |
| Arabs | 15.8 /100 | #195 | Poor 11.6% |
| Hmong | 15.8 /100 | #196 | Poor 11.6% |
| Delaware | 15.4 /100 | #197 | Poor 11.7% |
| Iraqis | 14.7 /100 | #198 | Poor 11.7% |
| Spanish | 14.1 /100 | #199 | Poor 11.7% |
| Immigrants | Lebanon | 13.6 /100 | #200 | Poor 11.7% |
| Spaniards | 13.5 /100 | #201 | Poor 11.7% |
| Aleuts | 10.4 /100 | #202 | Poor 11.8% |
| Immigrants | Western Asia | 9.8 /100 | #203 | Tragic 11.8% |
| Immigrants | Uganda | 8.5 /100 | #204 | Tragic 11.8% |
Demographics Similar to Immigrants from Philippines by Male Poverty
In terms of male poverty, the demographic groups most similar to Immigrants from Philippines are Slovene (10.0%, a difference of 0.050%), Immigrants from Croatia (10.0%, a difference of 0.10%), Immigrants from Japan (10.0%, a difference of 0.14%), Immigrants from Singapore (10.0%, a difference of 0.15%), and Asian (10.0%, a difference of 0.19%).
| Demographics | Rating | Rank | Male Poverty |
| Immigrants | Moldova | 99.0 /100 | #43 | Exceptional 9.9% |
| Immigrants | Romania | 98.9 /100 | #44 | Exceptional 9.9% |
| Immigrants | Serbia | 98.9 /100 | #45 | Exceptional 10.0% |
| Turks | 98.9 /100 | #46 | Exceptional 10.0% |
| Immigrants | Singapore | 98.8 /100 | #47 | Exceptional 10.0% |
| Immigrants | Japan | 98.8 /100 | #48 | Exceptional 10.0% |
| Slovenes | 98.8 /100 | #49 | Exceptional 10.0% |
| Immigrants | Philippines | 98.7 /100 | #50 | Exceptional 10.0% |
| Immigrants | Croatia | 98.7 /100 | #51 | Exceptional 10.0% |
| Asians | 98.7 /100 | #52 | Exceptional 10.0% |
| Immigrants | Czechoslovakia | 98.6 /100 | #53 | Exceptional 10.0% |
| Immigrants | Austria | 98.5 /100 | #54 | Exceptional 10.0% |
| Germans | 98.3 /100 | #55 | Exceptional 10.1% |
| Immigrants | Bulgaria | 98.2 /100 | #56 | Exceptional 10.1% |
| Estonians | 98.1 /100 | #57 | Exceptional 10.1% |