Delaware vs British West Indian Male Poverty
COMPARE
Delaware
British West Indian
Male Poverty
Male Poverty Comparison
Delaware
British West Indians
11.7%
MALE POVERTY
15.4/ 100
METRIC RATING
197th/ 347
METRIC RANK
14.6%
MALE POVERTY
0.0/ 100
METRIC RATING
316th/ 347
METRIC RANK
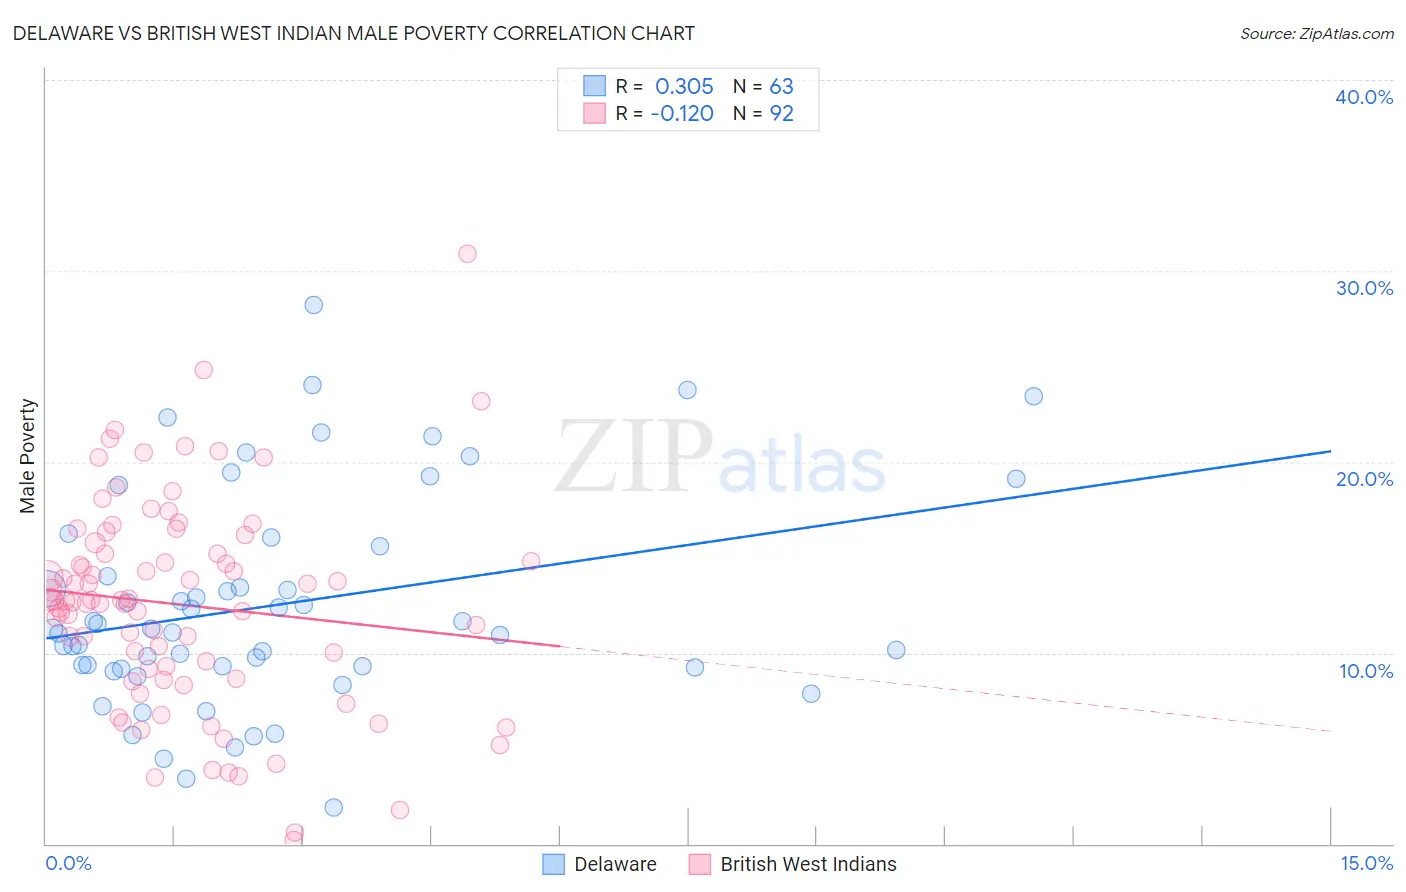
Delaware vs British West Indian Male Poverty Correlation Chart
The statistical analysis conducted on geographies consisting of 96,214,887 people shows a mild positive correlation between the proportion of Delaware and poverty level among males in the United States with a correlation coefficient (R) of 0.305 and weighted average of 11.7%. Similarly, the statistical analysis conducted on geographies consisting of 152,618,428 people shows a poor negative correlation between the proportion of British West Indians and poverty level among males in the United States with a correlation coefficient (R) of -0.120 and weighted average of 14.6%, a difference of 25.3%.
Male Poverty Correlation Summary
| Measurement | Delaware | British West Indian |
| Minimum | 1.9% | 0.21% |
| Maximum | 28.2% | 30.9% |
| Range | 26.3% | 30.7% |
| Mean | 12.5% | 12.5% |
| Median | 11.2% | 12.7% |
| Interquartile 25% (IQ1) | 9.2% | 8.9% |
| Interquartile 75% (IQ3) | 15.6% | 15.5% |
| Interquartile Range (IQR) | 6.4% | 6.6% |
| Standard Deviation (Sample) | 5.6% | 5.5% |
| Standard Deviation (Population) | 5.6% | 5.5% |
Similar Demographics by Male Poverty
Demographics Similar to Delaware by Male Poverty
In terms of male poverty, the demographic groups most similar to Delaware are Hmong (11.6%, a difference of 0.060%), Arab (11.6%, a difference of 0.070%), Immigrants from Kenya (11.6%, a difference of 0.12%), Iraqi (11.7%, a difference of 0.14%), and Spanish (11.7%, a difference of 0.24%).
| Demographics | Rating | Rank | Male Poverty |
| Israelis | 26.1 /100 | #190 | Fair 11.5% |
| South American Indians | 22.8 /100 | #191 | Fair 11.5% |
| Immigrants | Uruguay | 19.1 /100 | #192 | Poor 11.6% |
| Immigrants | Kuwait | 17.3 /100 | #193 | Poor 11.6% |
| Immigrants | Kenya | 16.1 /100 | #194 | Poor 11.6% |
| Arabs | 15.8 /100 | #195 | Poor 11.6% |
| Hmong | 15.8 /100 | #196 | Poor 11.6% |
| Delaware | 15.4 /100 | #197 | Poor 11.7% |
| Iraqis | 14.7 /100 | #198 | Poor 11.7% |
| Spanish | 14.1 /100 | #199 | Poor 11.7% |
| Immigrants | Lebanon | 13.6 /100 | #200 | Poor 11.7% |
| Spaniards | 13.5 /100 | #201 | Poor 11.7% |
| Aleuts | 10.4 /100 | #202 | Poor 11.8% |
| Immigrants | Western Asia | 9.8 /100 | #203 | Tragic 11.8% |
| Immigrants | Uganda | 8.5 /100 | #204 | Tragic 11.8% |
Demographics Similar to British West Indians by Male Poverty
In terms of male poverty, the demographic groups most similar to British West Indians are Chippewa (14.6%, a difference of 0.020%), Immigrants from Honduras (14.6%, a difference of 0.10%), Immigrants from Somalia (14.6%, a difference of 0.14%), Immigrants from Dominica (14.7%, a difference of 0.68%), and Immigrants from Grenada (14.7%, a difference of 0.74%).
| Demographics | Rating | Rank | Male Poverty |
| Somalis | 0.0 /100 | #309 | Tragic 14.3% |
| Seminole | 0.0 /100 | #310 | Tragic 14.3% |
| Hondurans | 0.0 /100 | #311 | Tragic 14.3% |
| Choctaw | 0.0 /100 | #312 | Tragic 14.4% |
| Immigrants | Somalia | 0.0 /100 | #313 | Tragic 14.6% |
| Immigrants | Honduras | 0.0 /100 | #314 | Tragic 14.6% |
| Chippewa | 0.0 /100 | #315 | Tragic 14.6% |
| British West Indians | 0.0 /100 | #316 | Tragic 14.6% |
| Immigrants | Dominica | 0.0 /100 | #317 | Tragic 14.7% |
| Immigrants | Grenada | 0.0 /100 | #318 | Tragic 14.7% |
| U.S. Virgin Islanders | 0.0 /100 | #319 | Tragic 14.7% |
| Immigrants | Congo | 0.0 /100 | #320 | Tragic 14.7% |
| Arapaho | 0.0 /100 | #321 | Tragic 15.1% |
| Kiowa | 0.0 /100 | #322 | Tragic 15.2% |
| Colville | 0.0 /100 | #323 | Tragic 15.2% |