Delaware vs Bermudan Female Poverty
COMPARE
Delaware
Bermudan
Female Poverty
Female Poverty Comparison
Delaware
Bermudans
13.7%
FEMALE POVERTY
31.1/ 100
METRIC RATING
194th/ 347
METRIC RANK
14.4%
FEMALE POVERTY
5.5/ 100
METRIC RATING
212th/ 347
METRIC RANK
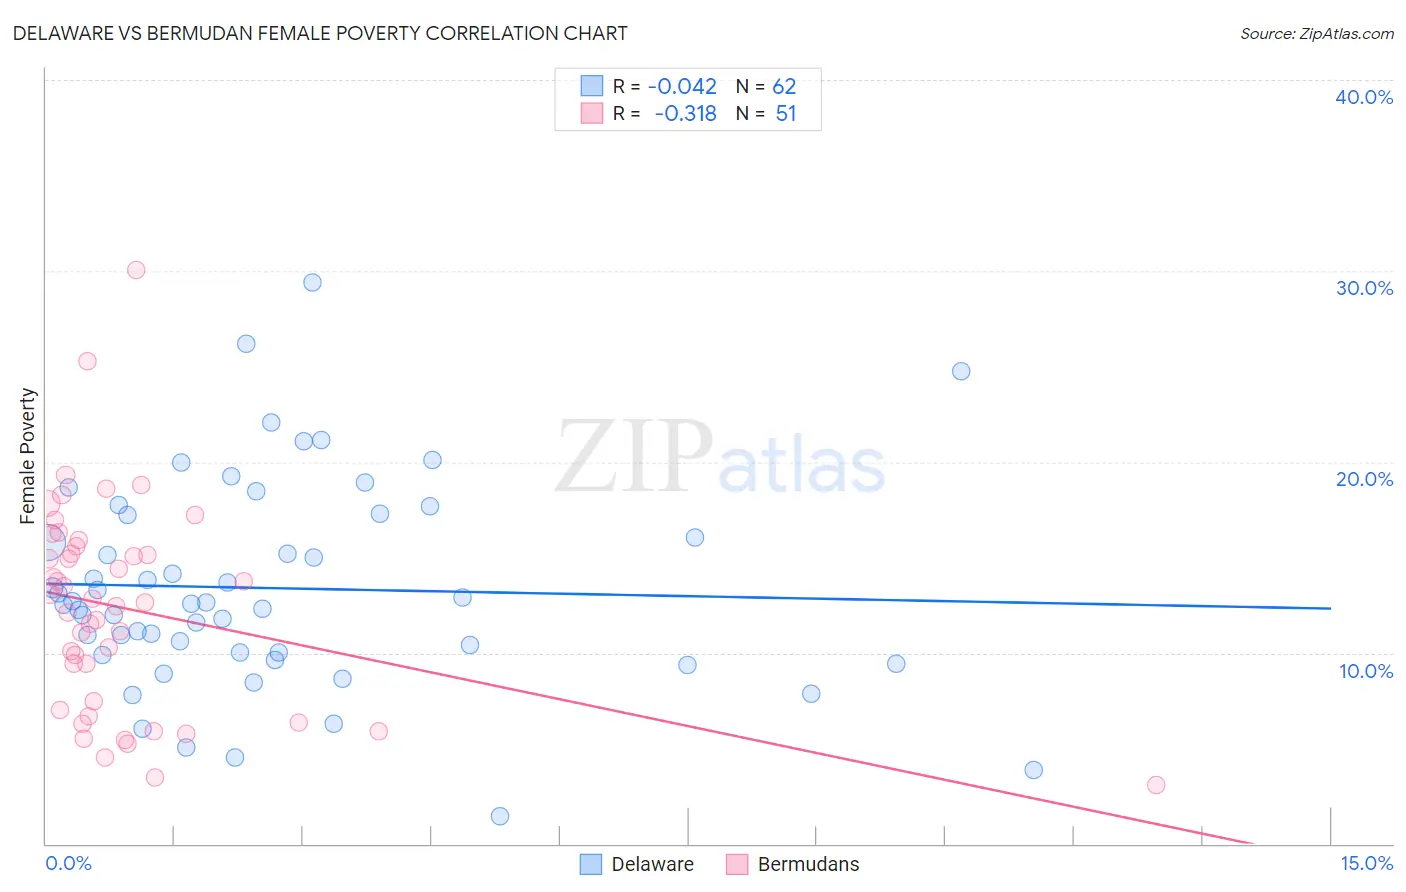
Delaware vs Bermudan Female Poverty Correlation Chart
The statistical analysis conducted on geographies consisting of 96,212,785 people shows no correlation between the proportion of Delaware and poverty level among females in the United States with a correlation coefficient (R) of -0.042 and weighted average of 13.7%. Similarly, the statistical analysis conducted on geographies consisting of 55,716,155 people shows a mild negative correlation between the proportion of Bermudans and poverty level among females in the United States with a correlation coefficient (R) of -0.318 and weighted average of 14.4%, a difference of 4.8%.
Female Poverty Correlation Summary
| Measurement | Delaware | Bermudan |
| Minimum | 1.5% | 3.1% |
| Maximum | 29.4% | 30.0% |
| Range | 27.9% | 26.9% |
| Mean | 13.4% | 12.3% |
| Median | 12.6% | 12.6% |
| Interquartile 25% (IQ1) | 10.0% | 7.0% |
| Interquartile 75% (IQ3) | 17.2% | 15.6% |
| Interquartile Range (IQR) | 7.2% | 8.5% |
| Standard Deviation (Sample) | 5.4% | 5.5% |
| Standard Deviation (Population) | 5.4% | 5.5% |
Demographics Similar to Delaware and Bermudans by Female Poverty
In terms of female poverty, the demographic groups most similar to Delaware are Immigrants from South America (13.7%, a difference of 0.060%), Iraqi (13.7%, a difference of 0.070%), South American Indian (13.7%, a difference of 0.25%), Arab (13.7%, a difference of 0.29%), and Immigrants from Uganda (13.7%, a difference of 0.30%). Similarly, the demographic groups most similar to Bermudans are Alaskan Athabascan (14.4%, a difference of 0.080%), Moroccan (14.3%, a difference of 0.63%), Malaysian (14.3%, a difference of 0.72%), Panamanian (14.2%, a difference of 0.80%), and Immigrants from the Azores (14.2%, a difference of 0.86%).
| Demographics | Rating | Rank | Female Poverty |
| Iraqis | 31.8 /100 | #193 | Fair 13.7% |
| Delaware | 31.1 /100 | #194 | Fair 13.7% |
| Immigrants | South America | 30.6 /100 | #195 | Fair 13.7% |
| South American Indians | 28.9 /100 | #196 | Fair 13.7% |
| Arabs | 28.6 /100 | #197 | Fair 13.7% |
| Immigrants | Uganda | 28.5 /100 | #198 | Fair 13.7% |
| Immigrants | Lebanon | 25.6 /100 | #199 | Fair 13.8% |
| Spanish | 21.4 /100 | #200 | Fair 13.9% |
| Immigrants | Kenya | 21.1 /100 | #201 | Fair 13.9% |
| Hmong | 21.1 /100 | #202 | Fair 13.9% |
| Immigrants | Western Asia | 20.7 /100 | #203 | Fair 13.9% |
| Spaniards | 18.9 /100 | #204 | Poor 13.9% |
| Ugandans | 15.4 /100 | #205 | Poor 14.0% |
| Immigrants | Uruguay | 14.0 /100 | #206 | Poor 14.0% |
| Immigrants | Eastern Africa | 9.0 /100 | #207 | Tragic 14.2% |
| Immigrants | Azores | 7.9 /100 | #208 | Tragic 14.2% |
| Panamanians | 7.7 /100 | #209 | Tragic 14.2% |
| Malaysians | 7.4 /100 | #210 | Tragic 14.3% |
| Moroccans | 7.2 /100 | #211 | Tragic 14.3% |
| Bermudans | 5.5 /100 | #212 | Tragic 14.4% |
| Alaskan Athabascans | 5.3 /100 | #213 | Tragic 14.4% |