Cuban vs Immigrants from Bangladesh Female Poverty
COMPARE
Cuban
Immigrants from Bangladesh
Female Poverty
Female Poverty Comparison
Cubans
Immigrants from Bangladesh
15.3%
FEMALE POVERTY
0.3/ 100
METRIC RATING
246th/ 347
METRIC RANK
16.4%
FEMALE POVERTY
0.0/ 100
METRIC RATING
290th/ 347
METRIC RANK
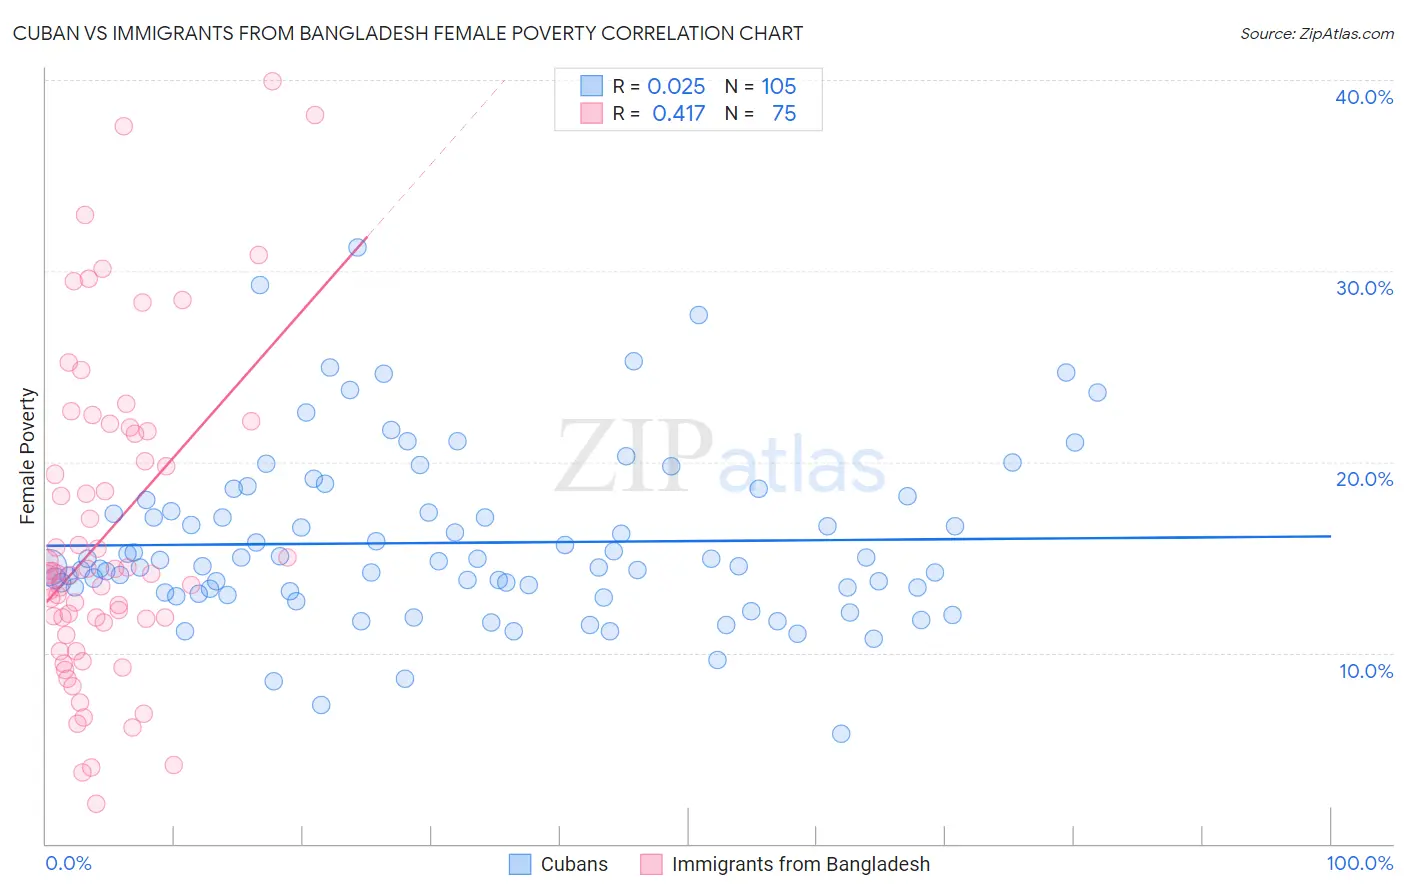
Cuban vs Immigrants from Bangladesh Female Poverty Correlation Chart
The statistical analysis conducted on geographies consisting of 448,858,548 people shows no correlation between the proportion of Cubans and poverty level among females in the United States with a correlation coefficient (R) of 0.025 and weighted average of 15.3%. Similarly, the statistical analysis conducted on geographies consisting of 203,545,805 people shows a moderate positive correlation between the proportion of Immigrants from Bangladesh and poverty level among females in the United States with a correlation coefficient (R) of 0.417 and weighted average of 16.4%, a difference of 7.1%.
Female Poverty Correlation Summary
| Measurement | Cuban | Immigrants from Bangladesh |
| Minimum | 5.8% | 2.1% |
| Maximum | 31.2% | 39.9% |
| Range | 25.5% | 37.8% |
| Mean | 15.8% | 16.3% |
| Median | 14.6% | 14.2% |
| Interquartile 25% (IQ1) | 13.2% | 11.6% |
| Interquartile 75% (IQ3) | 17.7% | 21.6% |
| Interquartile Range (IQR) | 4.5% | 10.0% |
| Standard Deviation (Sample) | 4.5% | 8.3% |
| Standard Deviation (Population) | 4.4% | 8.3% |
Similar Demographics by Female Poverty
Demographics Similar to Cubans by Female Poverty
In terms of female poverty, the demographic groups most similar to Cubans are Potawatomi (15.3%, a difference of 0.010%), Immigrants from Ghana (15.3%, a difference of 0.010%), Spanish American Indian (15.3%, a difference of 0.050%), Ecuadorian (15.3%, a difference of 0.15%), and Salvadoran (15.3%, a difference of 0.15%).
| Demographics | Rating | Rank | Female Poverty |
| Immigrants | Middle Africa | 0.5 /100 | #239 | Tragic 15.2% |
| Sudanese | 0.5 /100 | #240 | Tragic 15.2% |
| Immigrants | Sudan | 0.4 /100 | #241 | Tragic 15.2% |
| Nepalese | 0.4 /100 | #242 | Tragic 15.2% |
| Nicaraguans | 0.3 /100 | #243 | Tragic 15.3% |
| Ecuadorians | 0.3 /100 | #244 | Tragic 15.3% |
| Spanish American Indians | 0.3 /100 | #245 | Tragic 15.3% |
| Cubans | 0.3 /100 | #246 | Tragic 15.3% |
| Potawatomi | 0.3 /100 | #247 | Tragic 15.3% |
| Immigrants | Ghana | 0.3 /100 | #248 | Tragic 15.3% |
| Salvadorans | 0.3 /100 | #249 | Tragic 15.3% |
| Immigrants | Western Africa | 0.3 /100 | #250 | Tragic 15.3% |
| Immigrants | Trinidad and Tobago | 0.3 /100 | #251 | Tragic 15.4% |
| Immigrants | Burma/Myanmar | 0.3 /100 | #252 | Tragic 15.4% |
| Liberians | 0.2 /100 | #253 | Tragic 15.4% |
Demographics Similar to Immigrants from Bangladesh by Female Poverty
In terms of female poverty, the demographic groups most similar to Immigrants from Bangladesh are Yaqui (16.4%, a difference of 0.17%), Immigrants from Zaire (16.4%, a difference of 0.18%), Blackfeet (16.4%, a difference of 0.19%), Indonesian (16.4%, a difference of 0.20%), and Immigrants from Latin America (16.4%, a difference of 0.23%).
| Demographics | Rating | Rank | Female Poverty |
| Immigrants | Cuba | 0.0 /100 | #283 | Tragic 16.1% |
| Spanish Americans | 0.0 /100 | #284 | Tragic 16.2% |
| Comanche | 0.0 /100 | #285 | Tragic 16.2% |
| Inupiat | 0.0 /100 | #286 | Tragic 16.2% |
| Immigrants | Belize | 0.0 /100 | #287 | Tragic 16.3% |
| Indonesians | 0.0 /100 | #288 | Tragic 16.4% |
| Blackfeet | 0.0 /100 | #289 | Tragic 16.4% |
| Immigrants | Bangladesh | 0.0 /100 | #290 | Tragic 16.4% |
| Yaqui | 0.0 /100 | #291 | Tragic 16.4% |
| Immigrants | Zaire | 0.0 /100 | #292 | Tragic 16.4% |
| Immigrants | Latin America | 0.0 /100 | #293 | Tragic 16.4% |
| Immigrants | Cabo Verde | 0.0 /100 | #294 | Tragic 16.4% |
| Senegalese | 0.0 /100 | #295 | Tragic 16.5% |
| Immigrants | Senegal | 0.0 /100 | #296 | Tragic 16.5% |
| Mexicans | 0.0 /100 | #297 | Tragic 16.5% |