Croatian vs Sudanese Ambulatory Disability
COMPARE
Croatian
Sudanese
Ambulatory Disability
Ambulatory Disability Comparison
Croatians
Sudanese
6.1%
AMBULATORY DISABILITY
51.2/ 100
METRIC RATING
173rd/ 347
METRIC RANK
5.7%
AMBULATORY DISABILITY
99.3/ 100
METRIC RATING
76th/ 347
METRIC RANK
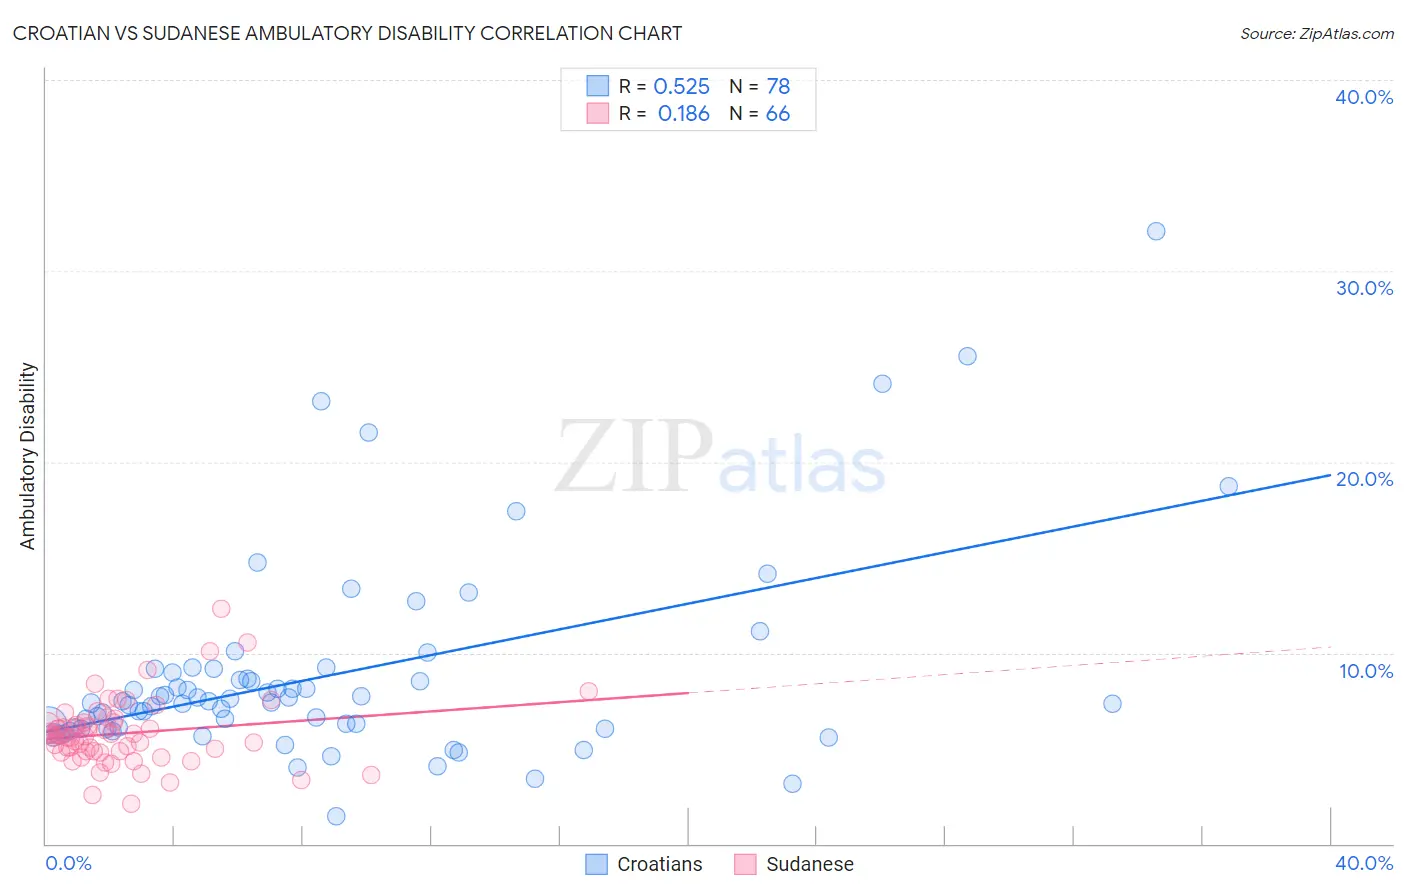
Croatian vs Sudanese Ambulatory Disability Correlation Chart
The statistical analysis conducted on geographies consisting of 375,651,055 people shows a substantial positive correlation between the proportion of Croatians and percentage of population with ambulatory disability in the United States with a correlation coefficient (R) of 0.525 and weighted average of 6.1%. Similarly, the statistical analysis conducted on geographies consisting of 110,129,493 people shows a poor positive correlation between the proportion of Sudanese and percentage of population with ambulatory disability in the United States with a correlation coefficient (R) of 0.186 and weighted average of 5.7%, a difference of 7.0%.
Ambulatory Disability Correlation Summary
| Measurement | Croatian | Sudanese |
| Minimum | 1.5% | 2.1% |
| Maximum | 32.1% | 12.3% |
| Range | 30.6% | 10.2% |
| Mean | 8.8% | 5.8% |
| Median | 7.4% | 5.6% |
| Interquartile 25% (IQ1) | 6.1% | 4.8% |
| Interquartile 75% (IQ3) | 8.9% | 6.3% |
| Interquartile Range (IQR) | 2.9% | 1.5% |
| Standard Deviation (Sample) | 5.3% | 1.8% |
| Standard Deviation (Population) | 5.2% | 1.7% |
Similar Demographics by Ambulatory Disability
Demographics Similar to Croatians by Ambulatory Disability
In terms of ambulatory disability, the demographic groups most similar to Croatians are Immigrants from Burma/Myanmar (6.1%, a difference of 0.050%), Immigrants from Canada (6.1%, a difference of 0.060%), Moroccan (6.1%, a difference of 0.080%), Immigrants from Ecuador (6.1%, a difference of 0.14%), and Vietnamese (6.1%, a difference of 0.21%).
| Demographics | Rating | Rank | Ambulatory Disability |
| Iraqis | 62.8 /100 | #166 | Good 6.1% |
| Immigrants | Oceania | 60.7 /100 | #167 | Good 6.1% |
| Ecuadorians | 60.5 /100 | #168 | Good 6.1% |
| Immigrants | Southern Europe | 58.1 /100 | #169 | Average 6.1% |
| Immigrants | Ecuador | 53.8 /100 | #170 | Average 6.1% |
| Moroccans | 52.6 /100 | #171 | Average 6.1% |
| Immigrants | Burma/Myanmar | 52.2 /100 | #172 | Average 6.1% |
| Croatians | 51.2 /100 | #173 | Average 6.1% |
| Immigrants | Canada | 50.0 /100 | #174 | Average 6.1% |
| Vietnamese | 47.2 /100 | #175 | Average 6.1% |
| Immigrants | North America | 45.6 /100 | #176 | Average 6.1% |
| Immigrants | England | 45.4 /100 | #177 | Average 6.1% |
| Scandinavians | 44.5 /100 | #178 | Average 6.1% |
| Austrians | 44.1 /100 | #179 | Average 6.1% |
| Immigrants | Nicaragua | 43.9 /100 | #180 | Average 6.1% |
Demographics Similar to Sudanese by Ambulatory Disability
In terms of ambulatory disability, the demographic groups most similar to Sudanese are Immigrants from South Africa (5.7%, a difference of 0.020%), Immigrants from Cameroon (5.7%, a difference of 0.070%), Immigrants from Northern Africa (5.7%, a difference of 0.080%), Brazilian (5.7%, a difference of 0.090%), and Immigrants from Peru (5.7%, a difference of 0.12%).
| Demographics | Rating | Rank | Ambulatory Disability |
| Peruvians | 99.5 /100 | #69 | Exceptional 5.7% |
| Sierra Leoneans | 99.4 /100 | #70 | Exceptional 5.7% |
| Immigrants | Peru | 99.4 /100 | #71 | Exceptional 5.7% |
| Brazilians | 99.4 /100 | #72 | Exceptional 5.7% |
| Immigrants | Northern Africa | 99.4 /100 | #73 | Exceptional 5.7% |
| Immigrants | Cameroon | 99.4 /100 | #74 | Exceptional 5.7% |
| Immigrants | South Africa | 99.3 /100 | #75 | Exceptional 5.7% |
| Sudanese | 99.3 /100 | #76 | Exceptional 5.7% |
| Immigrants | Vietnam | 99.3 /100 | #77 | Exceptional 5.7% |
| Somalis | 99.2 /100 | #78 | Exceptional 5.7% |
| Chileans | 99.2 /100 | #79 | Exceptional 5.7% |
| Immigrants | Ireland | 99.2 /100 | #80 | Exceptional 5.7% |
| Immigrants | Jordan | 99.2 /100 | #81 | Exceptional 5.7% |
| Palestinians | 99.2 /100 | #82 | Exceptional 5.7% |
| Eastern Europeans | 99.2 /100 | #83 | Exceptional 5.7% |