Croatian vs Immigrants from Sierra Leone Single Male Poverty
COMPARE
Croatian
Immigrants from Sierra Leone
Single Male Poverty
Single Male Poverty Comparison
Croatians
Immigrants from Sierra Leone
12.8%
SINGLE MALE POVERTY
48.9/ 100
METRIC RATING
175th/ 347
METRIC RANK
12.5%
SINGLE MALE POVERTY
85.5/ 100
METRIC RATING
129th/ 347
METRIC RANK
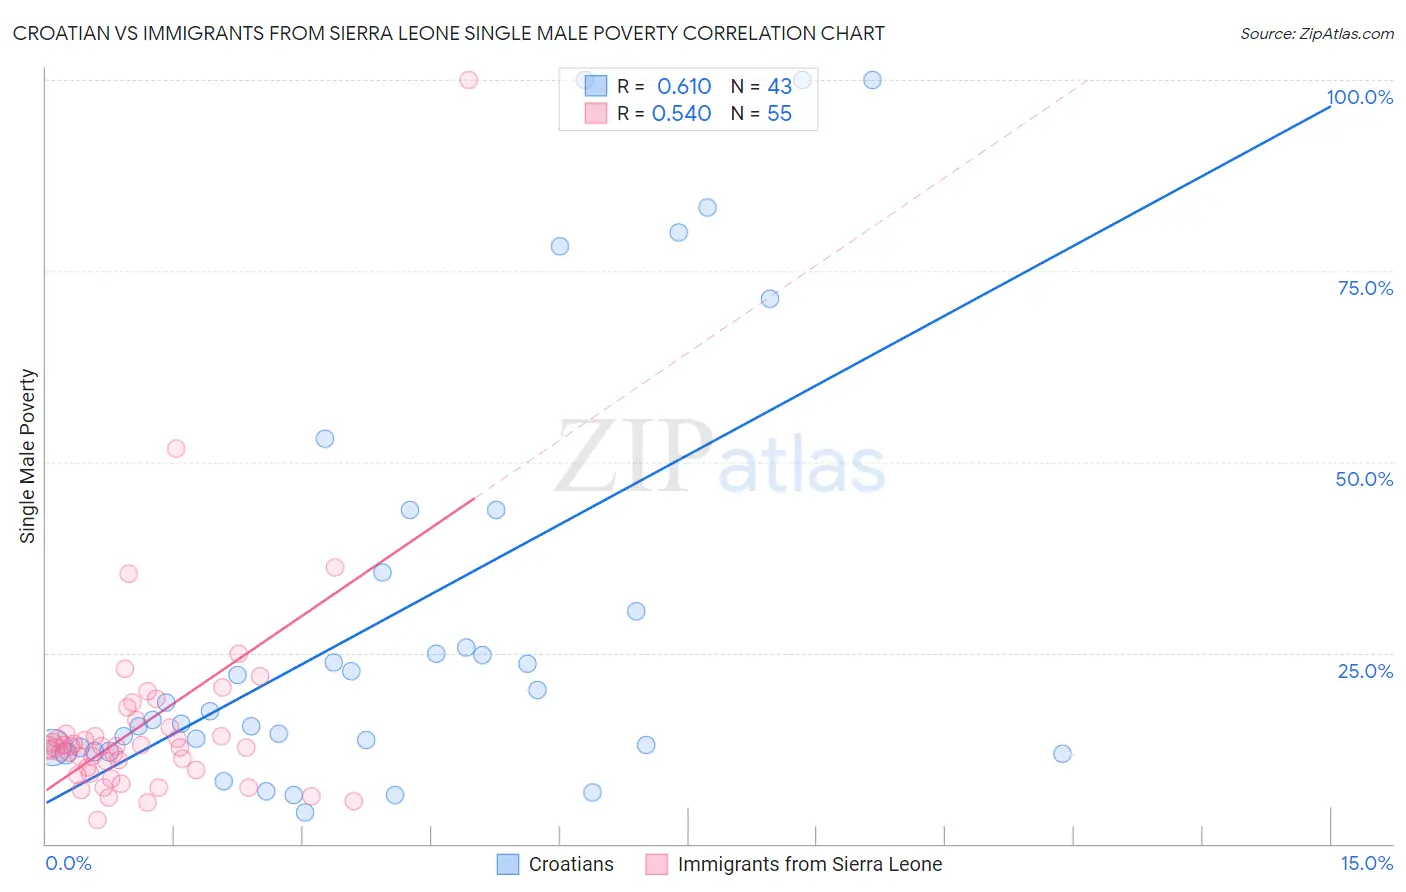
Croatian vs Immigrants from Sierra Leone Single Male Poverty Correlation Chart
The statistical analysis conducted on geographies consisting of 328,638,760 people shows a significant positive correlation between the proportion of Croatians and poverty level among single males in the United States with a correlation coefficient (R) of 0.610 and weighted average of 12.8%. Similarly, the statistical analysis conducted on geographies consisting of 97,204,981 people shows a substantial positive correlation between the proportion of Immigrants from Sierra Leone and poverty level among single males in the United States with a correlation coefficient (R) of 0.540 and weighted average of 12.5%, a difference of 2.5%.
Single Male Poverty Correlation Summary
| Measurement | Croatian | Immigrants from Sierra Leone |
| Minimum | 4.2% | 3.2% |
| Maximum | 100.0% | 100.0% |
| Range | 95.8% | 96.8% |
| Mean | 29.9% | 15.6% |
| Median | 17.3% | 12.7% |
| Interquartile 25% (IQ1) | 12.5% | 9.6% |
| Interquartile 75% (IQ3) | 35.6% | 15.2% |
| Interquartile Range (IQR) | 23.0% | 5.6% |
| Standard Deviation (Sample) | 28.1% | 14.2% |
| Standard Deviation (Population) | 27.7% | 14.0% |
Similar Demographics by Single Male Poverty
Demographics Similar to Croatians by Single Male Poverty
In terms of single male poverty, the demographic groups most similar to Croatians are Syrian (12.8%, a difference of 0.020%), Costa Rican (12.8%, a difference of 0.060%), Immigrants from St. Vincent and the Grenadines (12.8%, a difference of 0.11%), South African (12.8%, a difference of 0.14%), and Danish (12.8%, a difference of 0.14%).
| Demographics | Rating | Rank | Single Male Poverty |
| Immigrants | Barbados | 57.7 /100 | #168 | Average 12.7% |
| Puget Sound Salish | 54.3 /100 | #169 | Average 12.8% |
| Guyanese | 52.0 /100 | #170 | Average 12.8% |
| South Africans | 51.5 /100 | #171 | Average 12.8% |
| Danes | 51.4 /100 | #172 | Average 12.8% |
| Immigrants | St. Vincent and the Grenadines | 50.9 /100 | #173 | Average 12.8% |
| Costa Ricans | 50.0 /100 | #174 | Average 12.8% |
| Croatians | 48.9 /100 | #175 | Average 12.8% |
| Syrians | 48.4 /100 | #176 | Average 12.8% |
| Immigrants | Canada | 44.8 /100 | #177 | Average 12.8% |
| Immigrants | Switzerland | 43.1 /100 | #178 | Average 12.8% |
| Israelis | 41.0 /100 | #179 | Average 12.9% |
| Immigrants | North America | 37.7 /100 | #180 | Fair 12.9% |
| Panamanians | 37.6 /100 | #181 | Fair 12.9% |
| Moroccans | 36.8 /100 | #182 | Fair 12.9% |
Demographics Similar to Immigrants from Sierra Leone by Single Male Poverty
In terms of single male poverty, the demographic groups most similar to Immigrants from Sierra Leone are Ecuadorian (12.5%, a difference of 0.040%), Immigrants from Netherlands (12.5%, a difference of 0.080%), Immigrants from Nicaragua (12.5%, a difference of 0.080%), Romanian (12.5%, a difference of 0.090%), and Immigrants from Jordan (12.5%, a difference of 0.17%).
| Demographics | Rating | Rank | Single Male Poverty |
| Serbians | 87.9 /100 | #122 | Excellent 12.5% |
| Immigrants | Kenya | 87.6 /100 | #123 | Excellent 12.5% |
| Russians | 87.3 /100 | #124 | Excellent 12.5% |
| Immigrants | Jordan | 87.1 /100 | #125 | Excellent 12.5% |
| Romanians | 86.4 /100 | #126 | Excellent 12.5% |
| Immigrants | Netherlands | 86.2 /100 | #127 | Excellent 12.5% |
| Ecuadorians | 85.9 /100 | #128 | Excellent 12.5% |
| Immigrants | Sierra Leone | 85.5 /100 | #129 | Excellent 12.5% |
| Immigrants | Nicaragua | 84.8 /100 | #130 | Excellent 12.5% |
| Immigrants | Northern Europe | 83.7 /100 | #131 | Excellent 12.5% |
| Salvadorans | 83.7 /100 | #132 | Excellent 12.5% |
| Immigrants | Western Asia | 83.4 /100 | #133 | Excellent 12.5% |
| Immigrants | Ecuador | 82.1 /100 | #134 | Excellent 12.5% |
| Immigrants | Costa Rica | 81.9 /100 | #135 | Excellent 12.5% |
| Immigrants | Austria | 81.9 /100 | #136 | Excellent 12.5% |