Croatian vs Iraqi Single Male Poverty
COMPARE
Croatian
Iraqi
Single Male Poverty
Single Male Poverty Comparison
Croatians
Iraqis
12.8%
SINGLE MALE POVERTY
48.9/ 100
METRIC RATING
175th/ 347
METRIC RANK
12.3%
SINGLE MALE POVERTY
95.1/ 100
METRIC RATING
107th/ 347
METRIC RANK
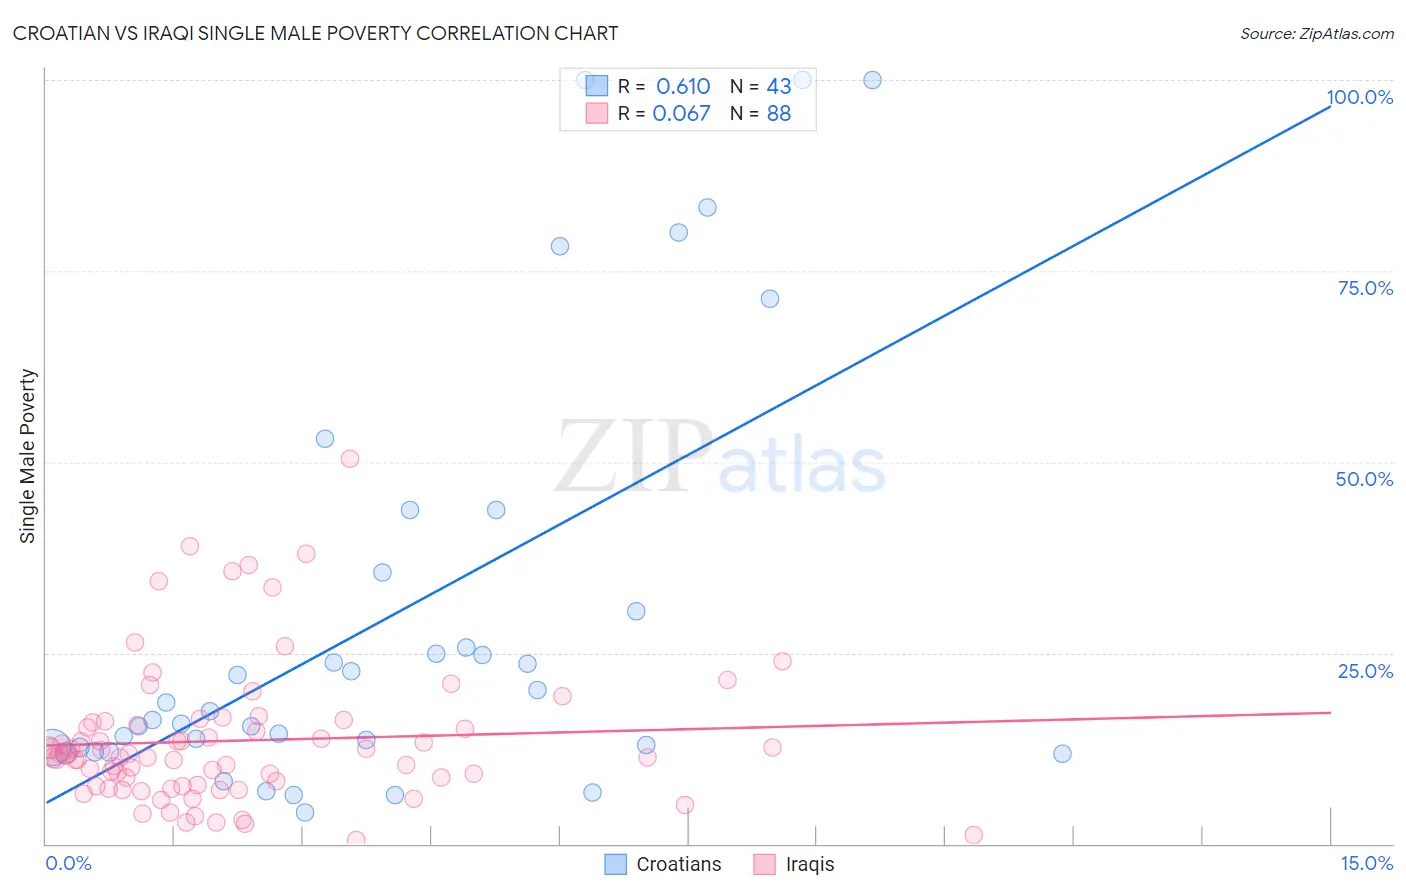
Croatian vs Iraqi Single Male Poverty Correlation Chart
The statistical analysis conducted on geographies consisting of 328,638,760 people shows a significant positive correlation between the proportion of Croatians and poverty level among single males in the United States with a correlation coefficient (R) of 0.610 and weighted average of 12.8%. Similarly, the statistical analysis conducted on geographies consisting of 160,224,189 people shows a slight positive correlation between the proportion of Iraqis and poverty level among single males in the United States with a correlation coefficient (R) of 0.067 and weighted average of 12.3%, a difference of 4.1%.
Single Male Poverty Correlation Summary
| Measurement | Croatian | Iraqi |
| Minimum | 4.2% | 0.42% |
| Maximum | 100.0% | 50.4% |
| Range | 95.8% | 50.0% |
| Mean | 29.9% | 13.5% |
| Median | 17.3% | 11.5% |
| Interquartile 25% (IQ1) | 12.5% | 7.6% |
| Interquartile 75% (IQ3) | 35.6% | 15.7% |
| Interquartile Range (IQR) | 23.0% | 8.1% |
| Standard Deviation (Sample) | 28.1% | 9.1% |
| Standard Deviation (Population) | 27.7% | 9.1% |
Similar Demographics by Single Male Poverty
Demographics Similar to Croatians by Single Male Poverty
In terms of single male poverty, the demographic groups most similar to Croatians are Syrian (12.8%, a difference of 0.020%), Costa Rican (12.8%, a difference of 0.060%), Immigrants from St. Vincent and the Grenadines (12.8%, a difference of 0.11%), South African (12.8%, a difference of 0.14%), and Danish (12.8%, a difference of 0.14%).
| Demographics | Rating | Rank | Single Male Poverty |
| Immigrants | Barbados | 57.7 /100 | #168 | Average 12.7% |
| Puget Sound Salish | 54.3 /100 | #169 | Average 12.8% |
| Guyanese | 52.0 /100 | #170 | Average 12.8% |
| South Africans | 51.5 /100 | #171 | Average 12.8% |
| Danes | 51.4 /100 | #172 | Average 12.8% |
| Immigrants | St. Vincent and the Grenadines | 50.9 /100 | #173 | Average 12.8% |
| Costa Ricans | 50.0 /100 | #174 | Average 12.8% |
| Croatians | 48.9 /100 | #175 | Average 12.8% |
| Syrians | 48.4 /100 | #176 | Average 12.8% |
| Immigrants | Canada | 44.8 /100 | #177 | Average 12.8% |
| Immigrants | Switzerland | 43.1 /100 | #178 | Average 12.8% |
| Israelis | 41.0 /100 | #179 | Average 12.9% |
| Immigrants | North America | 37.7 /100 | #180 | Fair 12.9% |
| Panamanians | 37.6 /100 | #181 | Fair 12.9% |
| Moroccans | 36.8 /100 | #182 | Fair 12.9% |
Demographics Similar to Iraqis by Single Male Poverty
In terms of single male poverty, the demographic groups most similar to Iraqis are Immigrants from Eastern Africa (12.3%, a difference of 0.020%), Ugandan (12.3%, a difference of 0.15%), Immigrants from Morocco (12.3%, a difference of 0.18%), Jordanian (12.3%, a difference of 0.26%), and Immigrants from Portugal (12.3%, a difference of 0.38%).
| Demographics | Rating | Rank | Single Male Poverty |
| Immigrants | Australia | 97.1 /100 | #100 | Exceptional 12.2% |
| Immigrants | Latvia | 97.0 /100 | #101 | Exceptional 12.2% |
| Immigrants | Europe | 97.0 /100 | #102 | Exceptional 12.2% |
| Immigrants | Armenia | 96.7 /100 | #103 | Exceptional 12.2% |
| Immigrants | Kazakhstan | 96.7 /100 | #104 | Exceptional 12.2% |
| Jordanians | 95.9 /100 | #105 | Exceptional 12.3% |
| Immigrants | Morocco | 95.6 /100 | #106 | Exceptional 12.3% |
| Iraqis | 95.1 /100 | #107 | Exceptional 12.3% |
| Immigrants | Eastern Africa | 95.0 /100 | #108 | Exceptional 12.3% |
| Ugandans | 94.5 /100 | #109 | Exceptional 12.3% |
| Immigrants | Portugal | 93.6 /100 | #110 | Exceptional 12.3% |
| Immigrants | North Macedonia | 93.6 /100 | #111 | Exceptional 12.3% |
| Kenyans | 93.3 /100 | #112 | Exceptional 12.4% |
| Pakistanis | 92.4 /100 | #113 | Exceptional 12.4% |
| Nicaraguans | 92.1 /100 | #114 | Exceptional 12.4% |