Croatian vs British West Indian Median Family Income
COMPARE
Croatian
British West Indian
Median Family Income
Median Family Income Comparison
Croatians
British West Indians
$111,370
MEDIAN FAMILY INCOME
98.8/ 100
METRIC RATING
85th/ 347
METRIC RANK
$88,987
MEDIAN FAMILY INCOME
0.1/ 100
METRIC RATING
280th/ 347
METRIC RANK
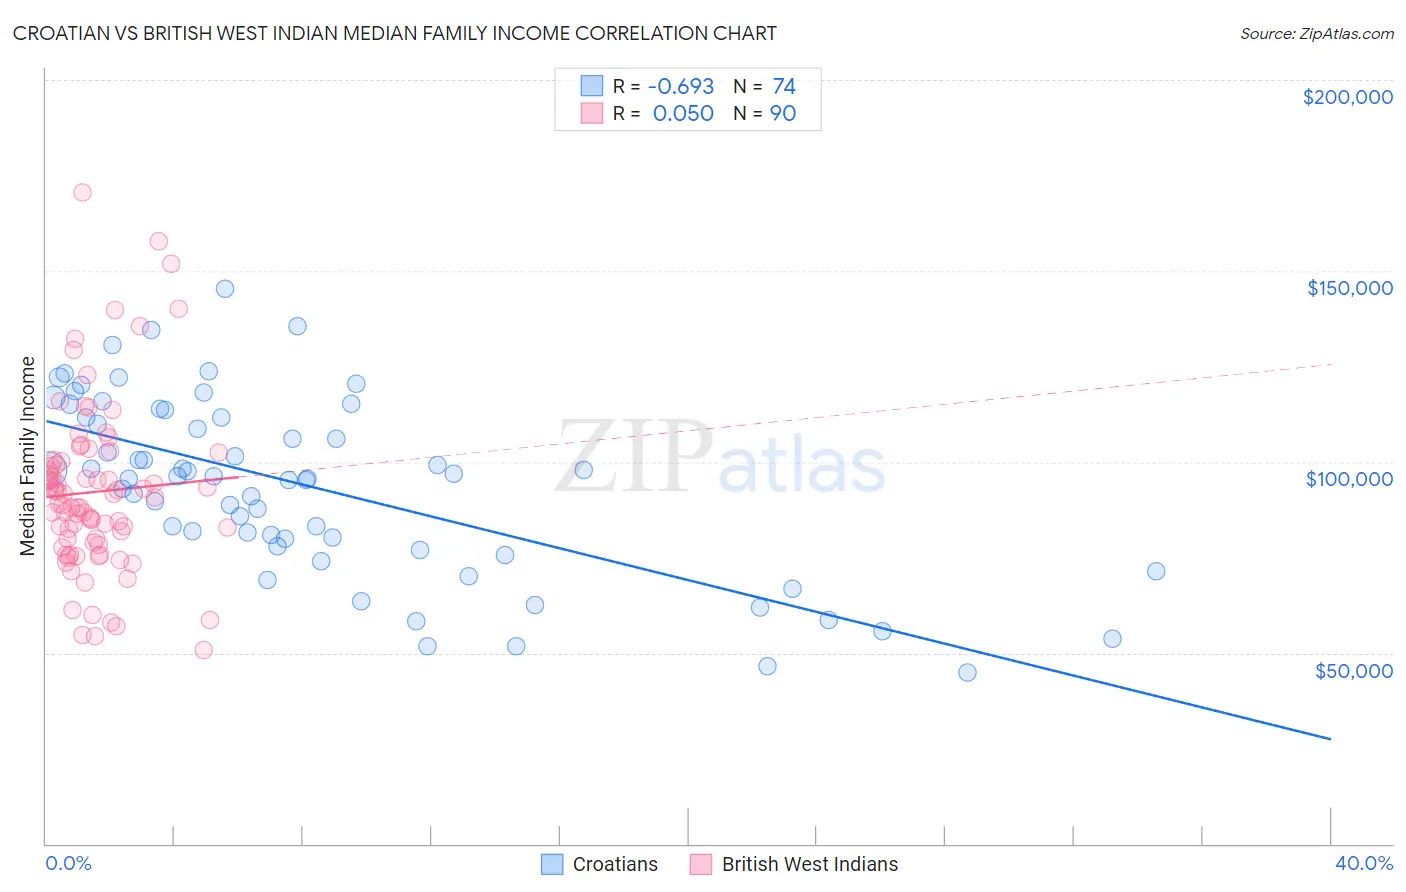
Croatian vs British West Indian Median Family Income Correlation Chart
The statistical analysis conducted on geographies consisting of 375,427,421 people shows a significant negative correlation between the proportion of Croatians and median family income in the United States with a correlation coefficient (R) of -0.693 and weighted average of $111,370. Similarly, the statistical analysis conducted on geographies consisting of 152,609,449 people shows no correlation between the proportion of British West Indians and median family income in the United States with a correlation coefficient (R) of 0.050 and weighted average of $88,987, a difference of 25.2%.
Median Family Income Correlation Summary
| Measurement | Croatian | British West Indian |
| Minimum | $44,806 | $50,788 |
| Maximum | $145,180 | $170,703 |
| Range | $100,374 | $119,915 |
| Mean | $93,423 | $92,168 |
| Median | $95,958 | $89,815 |
| Interquartile 25% (IQ1) | $78,056 | $78,814 |
| Interquartile 75% (IQ3) | $111,742 | $100,192 |
| Interquartile Range (IQR) | $33,686 | $21,378 |
| Standard Deviation (Sample) | $23,244 | $22,307 |
| Standard Deviation (Population) | $23,087 | $22,182 |
Similar Demographics by Median Family Income
Demographics Similar to Croatians by Median Family Income
In terms of median family income, the demographic groups most similar to Croatians are Ukrainian ($111,368, a difference of 0.0%), Immigrants from Hungary ($111,378, a difference of 0.010%), Austrian ($111,306, a difference of 0.060%), Romanian ($111,243, a difference of 0.11%), and Immigrants from Egypt ($111,689, a difference of 0.29%).
| Demographics | Rating | Rank | Median Family Income |
| Immigrants | Canada | 99.3 /100 | #78 | Exceptional $112,374 |
| Italians | 99.3 /100 | #79 | Exceptional $112,372 |
| Immigrants | Croatia | 99.3 /100 | #80 | Exceptional $112,323 |
| Immigrants | North America | 99.2 /100 | #81 | Exceptional $112,151 |
| Immigrants | England | 99.2 /100 | #82 | Exceptional $112,038 |
| Immigrants | Egypt | 99.0 /100 | #83 | Exceptional $111,689 |
| Immigrants | Hungary | 98.8 /100 | #84 | Exceptional $111,378 |
| Croatians | 98.8 /100 | #85 | Exceptional $111,370 |
| Ukrainians | 98.8 /100 | #86 | Exceptional $111,368 |
| Austrians | 98.8 /100 | #87 | Exceptional $111,306 |
| Romanians | 98.8 /100 | #88 | Exceptional $111,243 |
| Immigrants | Argentina | 98.5 /100 | #89 | Exceptional $110,873 |
| Northern Europeans | 98.3 /100 | #90 | Exceptional $110,635 |
| Immigrants | Southern Europe | 98.3 /100 | #91 | Exceptional $110,614 |
| Immigrants | Lebanon | 97.9 /100 | #92 | Exceptional $110,159 |
Demographics Similar to British West Indians by Median Family Income
In terms of median family income, the demographic groups most similar to British West Indians are Immigrants from Belize ($89,197, a difference of 0.24%), Immigrants from Grenada ($89,249, a difference of 0.29%), Blackfeet ($88,717, a difference of 0.30%), Immigrants from Jamaica ($89,268, a difference of 0.32%), and Immigrants from Zaire ($89,285, a difference of 0.33%).
| Demographics | Rating | Rank | Median Family Income |
| Immigrants | Micronesia | 0.2 /100 | #273 | Tragic $90,345 |
| Spanish Americans | 0.2 /100 | #274 | Tragic $90,322 |
| Immigrants | St. Vincent and the Grenadines | 0.2 /100 | #275 | Tragic $90,094 |
| Immigrants | Zaire | 0.1 /100 | #276 | Tragic $89,285 |
| Immigrants | Jamaica | 0.1 /100 | #277 | Tragic $89,268 |
| Immigrants | Grenada | 0.1 /100 | #278 | Tragic $89,249 |
| Immigrants | Belize | 0.1 /100 | #279 | Tragic $89,197 |
| British West Indians | 0.1 /100 | #280 | Tragic $88,987 |
| Blackfeet | 0.1 /100 | #281 | Tragic $88,717 |
| Comanche | 0.1 /100 | #282 | Tragic $88,556 |
| Bangladeshis | 0.1 /100 | #283 | Tragic $88,358 |
| Indonesians | 0.1 /100 | #284 | Tragic $88,301 |
| Guatemalans | 0.1 /100 | #285 | Tragic $88,295 |
| Immigrants | Nicaragua | 0.1 /100 | #286 | Tragic $88,267 |
| Potawatomi | 0.1 /100 | #287 | Tragic $88,265 |