Croatian vs British West Indian Female Unemployment
COMPARE
Croatian
British West Indian
Female Unemployment
Female Unemployment Comparison
Croatians
British West Indians
4.7%
FEMALE UNEMPLOYMENT
99.9/ 100
METRIC RATING
17th/ 347
METRIC RANK
6.4%
FEMALE UNEMPLOYMENT
0.0/ 100
METRIC RATING
318th/ 347
METRIC RANK
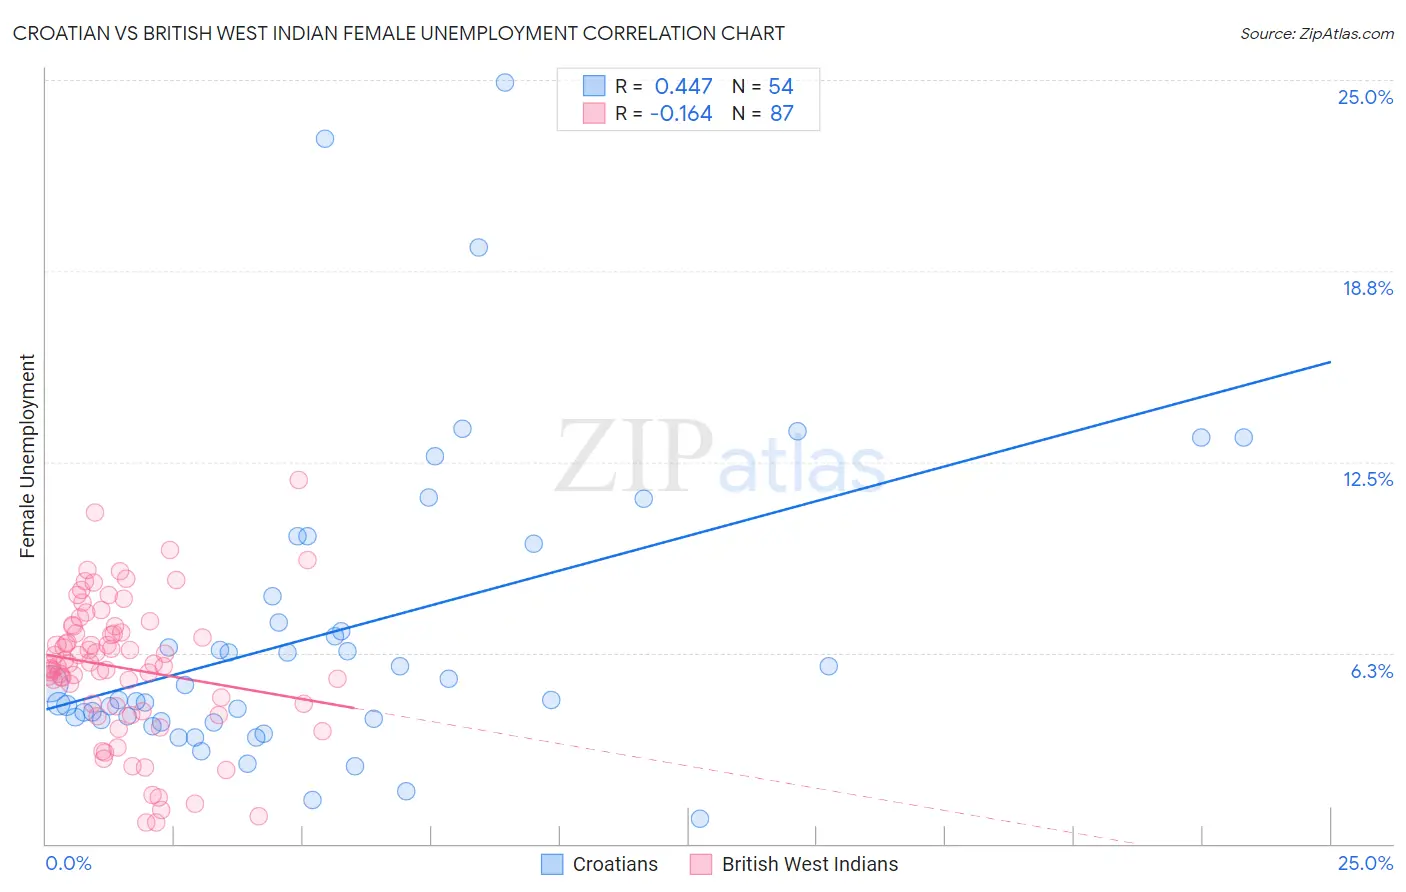
Croatian vs British West Indian Female Unemployment Correlation Chart
The statistical analysis conducted on geographies consisting of 373,417,382 people shows a moderate positive correlation between the proportion of Croatians and unemploymnet rate among females in the United States with a correlation coefficient (R) of 0.447 and weighted average of 4.7%. Similarly, the statistical analysis conducted on geographies consisting of 152,545,495 people shows a poor negative correlation between the proportion of British West Indians and unemploymnet rate among females in the United States with a correlation coefficient (R) of -0.164 and weighted average of 6.4%, a difference of 37.8%.
Female Unemployment Correlation Summary
| Measurement | Croatian | British West Indian |
| Minimum | 0.80% | 0.70% |
| Maximum | 24.9% | 11.9% |
| Range | 24.1% | 11.2% |
| Mean | 6.9% | 5.8% |
| Median | 4.9% | 5.9% |
| Interquartile 25% (IQ1) | 4.1% | 4.5% |
| Interquartile 75% (IQ3) | 8.1% | 7.1% |
| Interquartile Range (IQR) | 4.0% | 2.6% |
| Standard Deviation (Sample) | 5.0% | 2.3% |
| Standard Deviation (Population) | 5.0% | 2.3% |
Similar Demographics by Female Unemployment
Demographics Similar to Croatians by Female Unemployment
In terms of female unemployment, the demographic groups most similar to Croatians are Carpatho Rusyn (4.7%, a difference of 0.020%), Latvian (4.7%, a difference of 0.14%), Polish (4.7%, a difference of 0.16%), Bulgarian (4.7%, a difference of 0.24%), and Fijian (4.7%, a difference of 0.25%).
| Demographics | Rating | Rank | Female Unemployment |
| Swiss | 100.0 /100 | #10 | Exceptional 4.6% |
| Scandinavians | 100.0 /100 | #11 | Exceptional 4.6% |
| Dutch | 100.0 /100 | #12 | Exceptional 4.6% |
| Belgians | 100.0 /100 | #13 | Exceptional 4.6% |
| Finns | 100.0 /100 | #14 | Exceptional 4.6% |
| English | 100.0 /100 | #15 | Exceptional 4.6% |
| Carpatho Rusyns | 99.9 /100 | #16 | Exceptional 4.7% |
| Croatians | 99.9 /100 | #17 | Exceptional 4.7% |
| Latvians | 99.9 /100 | #18 | Exceptional 4.7% |
| Poles | 99.9 /100 | #19 | Exceptional 4.7% |
| Bulgarians | 99.9 /100 | #20 | Exceptional 4.7% |
| Fijians | 99.9 /100 | #21 | Exceptional 4.7% |
| Europeans | 99.9 /100 | #22 | Exceptional 4.7% |
| Scottish | 99.9 /100 | #23 | Exceptional 4.7% |
| Welsh | 99.9 /100 | #24 | Exceptional 4.7% |
Demographics Similar to British West Indians by Female Unemployment
In terms of female unemployment, the demographic groups most similar to British West Indians are Immigrants from Bangladesh (6.5%, a difference of 0.19%), Immigrants from Dominica (6.5%, a difference of 0.20%), Immigrants from St. Vincent and the Grenadines (6.4%, a difference of 0.28%), Houma (6.4%, a difference of 0.73%), and Black/African American (6.5%, a difference of 0.74%).
| Demographics | Rating | Rank | Female Unemployment |
| Immigrants | Mexico | 0.0 /100 | #311 | Tragic 6.3% |
| Immigrants | Grenada | 0.0 /100 | #312 | Tragic 6.3% |
| Belizeans | 0.0 /100 | #313 | Tragic 6.3% |
| Immigrants | Ecuador | 0.0 /100 | #314 | Tragic 6.4% |
| Pueblo | 0.0 /100 | #315 | Tragic 6.4% |
| Houma | 0.0 /100 | #316 | Tragic 6.4% |
| Immigrants | St. Vincent and the Grenadines | 0.0 /100 | #317 | Tragic 6.4% |
| British West Indians | 0.0 /100 | #318 | Tragic 6.4% |
| Immigrants | Bangladesh | 0.0 /100 | #319 | Tragic 6.5% |
| Immigrants | Dominica | 0.0 /100 | #320 | Tragic 6.5% |
| Blacks/African Americans | 0.0 /100 | #321 | Tragic 6.5% |
| Vietnamese | 0.0 /100 | #322 | Tragic 6.5% |
| Immigrants | Belize | 0.0 /100 | #323 | Tragic 6.5% |
| Cheyenne | 0.0 /100 | #324 | Tragic 6.6% |
| Apache | 0.0 /100 | #325 | Tragic 6.6% |