Potawatomi vs British West Indian Single Mother Poverty
COMPARE
Potawatomi
British West Indian
Single Mother Poverty
Single Mother Poverty Comparison
Potawatomi
British West Indians
34.1%
SINGLE MOTHER POVERTY
0.0/ 100
METRIC RATING
309th/ 347
METRIC RANK
31.5%
SINGLE MOTHER POVERTY
0.1/ 100
METRIC RATING
270th/ 347
METRIC RANK
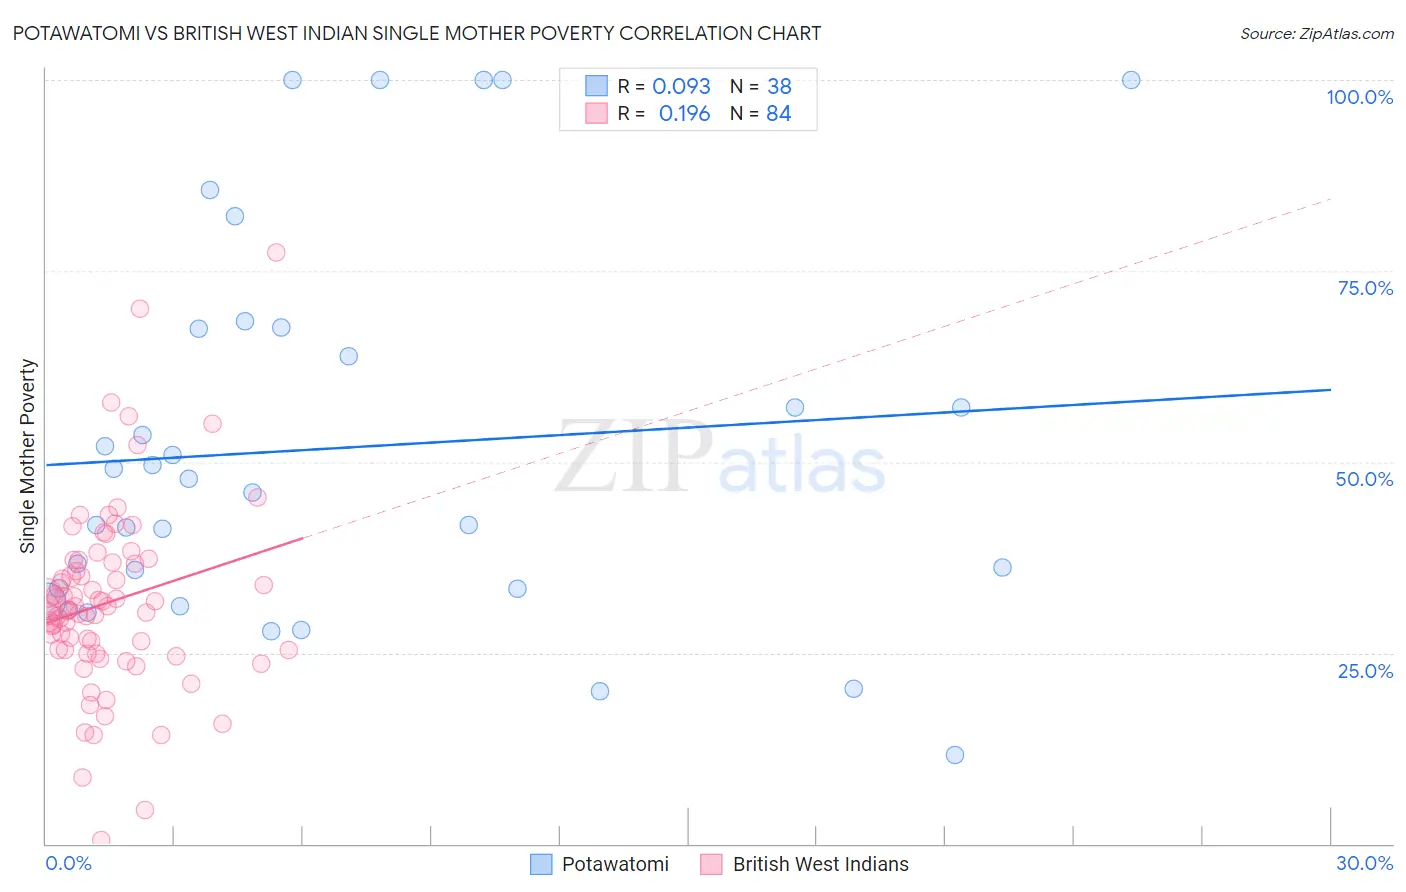
Potawatomi vs British West Indian Single Mother Poverty Correlation Chart
The statistical analysis conducted on geographies consisting of 116,799,639 people shows a slight positive correlation between the proportion of Potawatomi and poverty level among single mothers in the United States with a correlation coefficient (R) of 0.093 and weighted average of 34.1%. Similarly, the statistical analysis conducted on geographies consisting of 151,437,686 people shows a poor positive correlation between the proportion of British West Indians and poverty level among single mothers in the United States with a correlation coefficient (R) of 0.196 and weighted average of 31.5%, a difference of 8.4%.
Single Mother Poverty Correlation Summary
| Measurement | Potawatomi | British West Indian |
| Minimum | 11.6% | 0.48% |
| Maximum | 100.0% | 77.3% |
| Range | 88.4% | 76.9% |
| Mean | 51.9% | 31.6% |
| Median | 46.9% | 30.9% |
| Interquartile 25% (IQ1) | 33.3% | 25.4% |
| Interquartile 75% (IQ3) | 67.5% | 36.7% |
| Interquartile Range (IQR) | 34.2% | 11.3% |
| Standard Deviation (Sample) | 25.0% | 12.1% |
| Standard Deviation (Population) | 24.6% | 12.0% |
Similar Demographics by Single Mother Poverty
Demographics Similar to Potawatomi by Single Mother Poverty
In terms of single mother poverty, the demographic groups most similar to Potawatomi are Honduran (34.2%, a difference of 0.22%), Immigrants from Mexico (34.0%, a difference of 0.42%), Alsatian (34.3%, a difference of 0.53%), Comanche (33.9%, a difference of 0.60%), and Central American Indian (34.3%, a difference of 0.61%).
| Demographics | Rating | Rank | Single Mother Poverty |
| Arapaho | 0.0 /100 | #302 | Tragic 33.4% |
| Americans | 0.0 /100 | #303 | Tragic 33.5% |
| Mexicans | 0.0 /100 | #304 | Tragic 33.6% |
| Immigrants | Central America | 0.0 /100 | #305 | Tragic 33.6% |
| Immigrants | Congo | 0.0 /100 | #306 | Tragic 33.8% |
| Comanche | 0.0 /100 | #307 | Tragic 33.9% |
| Immigrants | Mexico | 0.0 /100 | #308 | Tragic 34.0% |
| Potawatomi | 0.0 /100 | #309 | Tragic 34.1% |
| Hondurans | 0.0 /100 | #310 | Tragic 34.2% |
| Alsatians | 0.0 /100 | #311 | Tragic 34.3% |
| Central American Indians | 0.0 /100 | #312 | Tragic 34.3% |
| Immigrants | Dominican Republic | 0.0 /100 | #313 | Tragic 34.4% |
| Chickasaw | 0.0 /100 | #314 | Tragic 34.4% |
| Hopi | 0.0 /100 | #315 | Tragic 34.5% |
| Dominicans | 0.0 /100 | #316 | Tragic 34.5% |
Demographics Similar to British West Indians by Single Mother Poverty
In terms of single mother poverty, the demographic groups most similar to British West Indians are Scotch-Irish (31.5%, a difference of 0.050%), Immigrants from Senegal (31.5%, a difference of 0.090%), Immigrants from Cabo Verde (31.6%, a difference of 0.24%), Immigrants from Micronesia (31.6%, a difference of 0.26%), and Immigrants from Belize (31.4%, a difference of 0.27%).
| Demographics | Rating | Rank | Single Mother Poverty |
| Bahamians | 0.2 /100 | #263 | Tragic 31.3% |
| Immigrants | Ecuador | 0.2 /100 | #264 | Tragic 31.3% |
| German Russians | 0.2 /100 | #265 | Tragic 31.3% |
| Sub-Saharan Africans | 0.2 /100 | #266 | Tragic 31.4% |
| Immigrants | Belize | 0.2 /100 | #267 | Tragic 31.4% |
| Immigrants | Senegal | 0.1 /100 | #268 | Tragic 31.5% |
| Scotch-Irish | 0.1 /100 | #269 | Tragic 31.5% |
| British West Indians | 0.1 /100 | #270 | Tragic 31.5% |
| Immigrants | Cabo Verde | 0.1 /100 | #271 | Tragic 31.6% |
| Immigrants | Micronesia | 0.1 /100 | #272 | Tragic 31.6% |
| Fijians | 0.1 /100 | #273 | Tragic 31.6% |
| Bangladeshis | 0.1 /100 | #274 | Tragic 31.7% |
| Central Americans | 0.1 /100 | #275 | Tragic 31.8% |
| Delaware | 0.0 /100 | #276 | Tragic 31.8% |
| Mexican American Indians | 0.0 /100 | #277 | Tragic 31.9% |