Croatian vs British West Indian Vision Disability
COMPARE
Croatian
British West Indian
Vision Disability
Vision Disability Comparison
Croatians
British West Indians
2.1%
VISION DISABILITY
92.3/ 100
METRIC RATING
114th/ 347
METRIC RANK
2.4%
VISION DISABILITY
0.2/ 100
METRIC RATING
258th/ 347
METRIC RANK
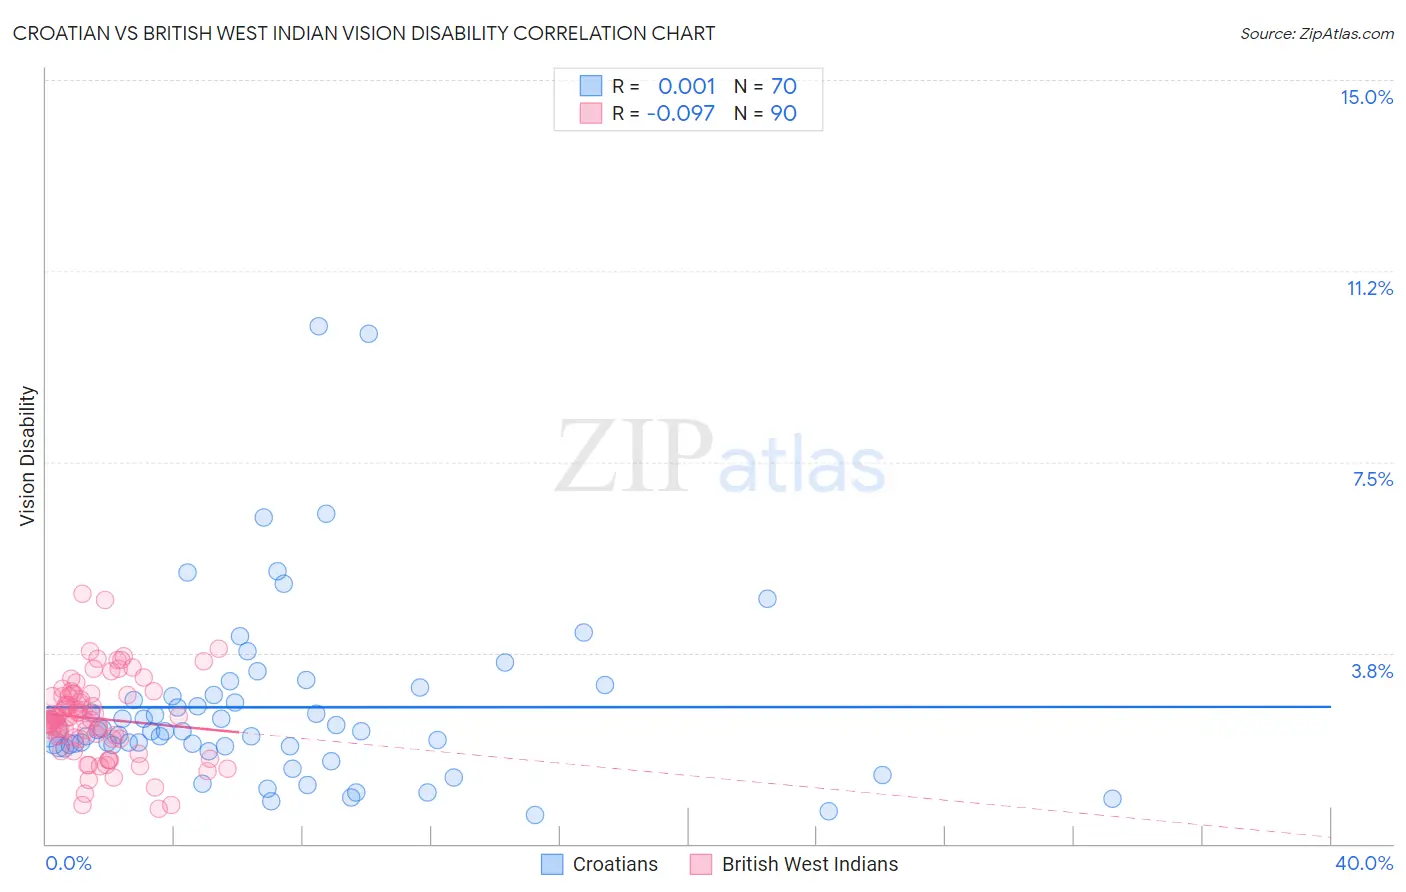
Croatian vs British West Indian Vision Disability Correlation Chart
The statistical analysis conducted on geographies consisting of 375,377,812 people shows no correlation between the proportion of Croatians and percentage of population with vision disability in the United States with a correlation coefficient (R) of 0.001 and weighted average of 2.1%. Similarly, the statistical analysis conducted on geographies consisting of 152,656,030 people shows a slight negative correlation between the proportion of British West Indians and percentage of population with vision disability in the United States with a correlation coefficient (R) of -0.097 and weighted average of 2.4%, a difference of 14.3%.
Vision Disability Correlation Summary
| Measurement | Croatian | British West Indian |
| Minimum | 0.57% | 0.69% |
| Maximum | 10.2% | 4.9% |
| Range | 9.6% | 4.2% |
| Mean | 2.7% | 2.5% |
| Median | 2.2% | 2.5% |
| Interquartile 25% (IQ1) | 1.9% | 2.1% |
| Interquartile 75% (IQ3) | 2.9% | 2.9% |
| Interquartile Range (IQR) | 1.00% | 0.88% |
| Standard Deviation (Sample) | 1.8% | 0.81% |
| Standard Deviation (Population) | 1.8% | 0.80% |
Similar Demographics by Vision Disability
Demographics Similar to Croatians by Vision Disability
In terms of vision disability, the demographic groups most similar to Croatians are Immigrants from Vietnam (2.1%, a difference of 0.020%), Kenyan (2.1%, a difference of 0.030%), Ugandan (2.1%, a difference of 0.030%), Polish (2.1%, a difference of 0.070%), and Immigrants from Denmark (2.1%, a difference of 0.15%).
| Demographics | Rating | Rank | Vision Disability |
| Danes | 94.2 /100 | #107 | Exceptional 2.1% |
| Koreans | 94.1 /100 | #108 | Exceptional 2.1% |
| Chileans | 94.0 /100 | #109 | Exceptional 2.1% |
| Immigrants | Armenia | 93.8 /100 | #110 | Exceptional 2.1% |
| Peruvians | 93.5 /100 | #111 | Exceptional 2.1% |
| Immigrants | Denmark | 92.9 /100 | #112 | Exceptional 2.1% |
| Kenyans | 92.5 /100 | #113 | Exceptional 2.1% |
| Croatians | 92.3 /100 | #114 | Exceptional 2.1% |
| Immigrants | Vietnam | 92.2 /100 | #115 | Exceptional 2.1% |
| Ugandans | 92.2 /100 | #116 | Exceptional 2.1% |
| Poles | 92.0 /100 | #117 | Exceptional 2.1% |
| Immigrants | Philippines | 91.4 /100 | #118 | Exceptional 2.1% |
| Immigrants | Uganda | 91.4 /100 | #119 | Exceptional 2.1% |
| Immigrants | Zimbabwe | 91.0 /100 | #120 | Exceptional 2.1% |
| Immigrants | Scotland | 90.4 /100 | #121 | Exceptional 2.1% |
Demographics Similar to British West Indians by Vision Disability
In terms of vision disability, the demographic groups most similar to British West Indians are White/Caucasian (2.4%, a difference of 0.010%), West Indian (2.4%, a difference of 0.030%), Immigrants from Haiti (2.4%, a difference of 0.10%), Belizean (2.4%, a difference of 0.18%), and Fijian (2.4%, a difference of 0.40%).
| Demographics | Rating | Rank | Vision Disability |
| Immigrants | Laos | 0.4 /100 | #251 | Tragic 2.4% |
| Immigrants | Micronesia | 0.3 /100 | #252 | Tragic 2.4% |
| Japanese | 0.3 /100 | #253 | Tragic 2.4% |
| Haitians | 0.3 /100 | #254 | Tragic 2.4% |
| Immigrants | Guatemala | 0.3 /100 | #255 | Tragic 2.4% |
| Immigrants | Haiti | 0.2 /100 | #256 | Tragic 2.4% |
| West Indians | 0.2 /100 | #257 | Tragic 2.4% |
| British West Indians | 0.2 /100 | #258 | Tragic 2.4% |
| Whites/Caucasians | 0.2 /100 | #259 | Tragic 2.4% |
| Belizeans | 0.2 /100 | #260 | Tragic 2.4% |
| Fijians | 0.1 /100 | #261 | Tragic 2.4% |
| Jamaicans | 0.1 /100 | #262 | Tragic 2.4% |
| Immigrants | Belize | 0.1 /100 | #263 | Tragic 2.4% |
| Immigrants | Liberia | 0.1 /100 | #264 | Tragic 2.4% |
| Immigrants | Jamaica | 0.1 /100 | #265 | Tragic 2.4% |