Finnish vs British West Indian Single Mother Poverty
COMPARE
Finnish
British West Indian
Single Mother Poverty
Single Mother Poverty Comparison
Finns
British West Indians
30.0%
SINGLE MOTHER POVERTY
9.3/ 100
METRIC RATING
219th/ 347
METRIC RANK
31.5%
SINGLE MOTHER POVERTY
0.1/ 100
METRIC RATING
270th/ 347
METRIC RANK
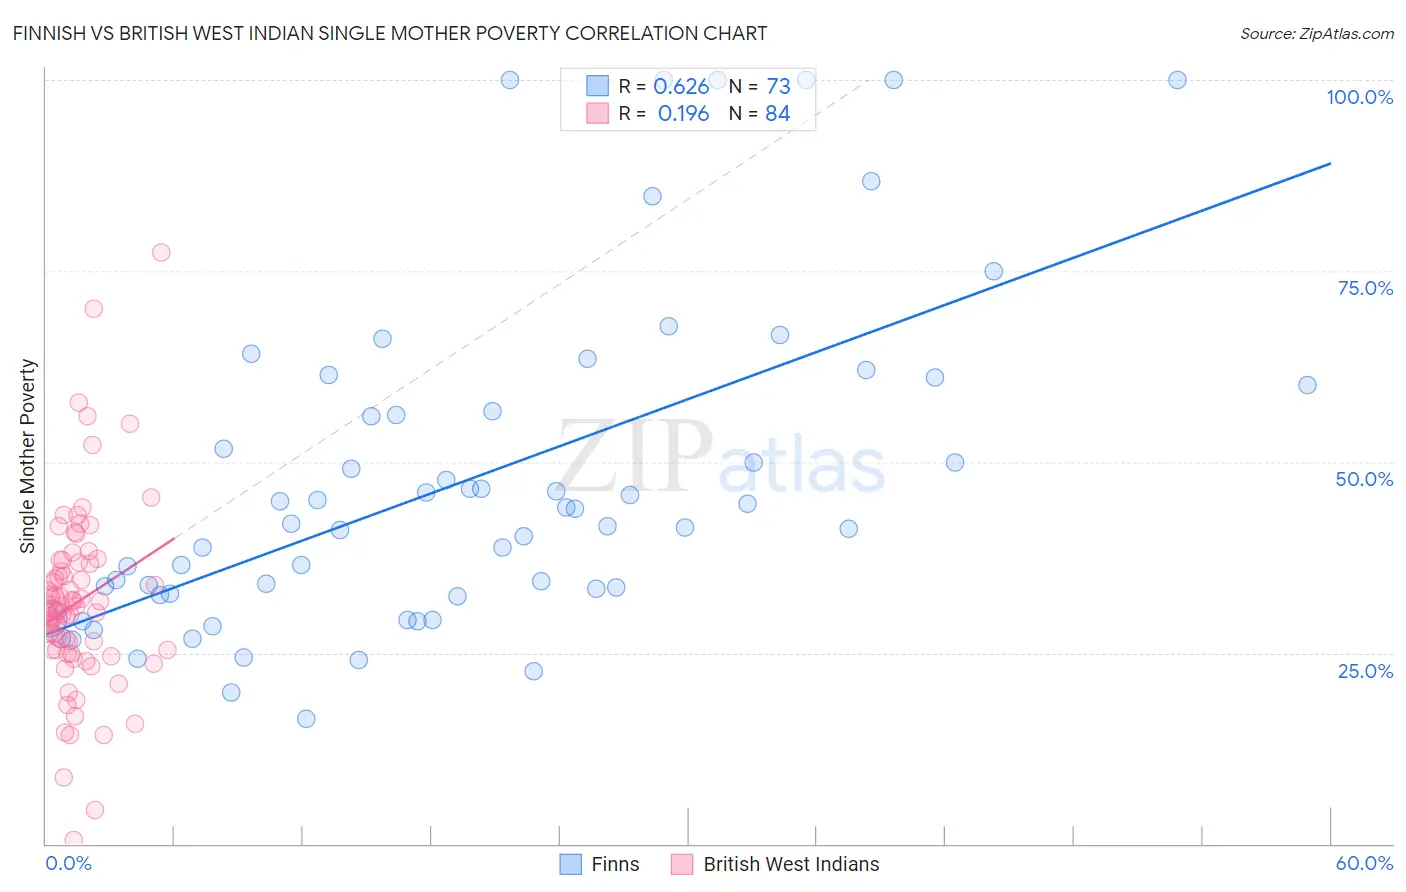
Finnish vs British West Indian Single Mother Poverty Correlation Chart
The statistical analysis conducted on geographies consisting of 392,432,308 people shows a significant positive correlation between the proportion of Finns and poverty level among single mothers in the United States with a correlation coefficient (R) of 0.626 and weighted average of 30.0%. Similarly, the statistical analysis conducted on geographies consisting of 151,437,686 people shows a poor positive correlation between the proportion of British West Indians and poverty level among single mothers in the United States with a correlation coefficient (R) of 0.196 and weighted average of 31.5%, a difference of 5.1%.
Single Mother Poverty Correlation Summary
| Measurement | Finnish | British West Indian |
| Minimum | 16.4% | 0.48% |
| Maximum | 100.0% | 77.3% |
| Range | 83.6% | 76.9% |
| Mean | 47.6% | 31.6% |
| Median | 42.0% | 30.9% |
| Interquartile 25% (IQ1) | 32.7% | 25.4% |
| Interquartile 75% (IQ3) | 58.3% | 36.7% |
| Interquartile Range (IQR) | 25.6% | 11.3% |
| Standard Deviation (Sample) | 21.5% | 12.1% |
| Standard Deviation (Population) | 21.4% | 12.0% |
Similar Demographics by Single Mother Poverty
Demographics Similar to Finns by Single Mother Poverty
In terms of single mother poverty, the demographic groups most similar to Finns are German (30.0%, a difference of 0.070%), Hungarian (29.9%, a difference of 0.14%), Immigrants from Ghana (29.9%, a difference of 0.25%), Immigrants from Eritrea (30.0%, a difference of 0.25%), and Sudanese (30.0%, a difference of 0.25%).
| Demographics | Rating | Rank | Single Mother Poverty |
| Nicaraguans | 12.4 /100 | #212 | Poor 29.8% |
| Immigrants | Thailand | 12.0 /100 | #213 | Poor 29.9% |
| Liberians | 11.7 /100 | #214 | Poor 29.9% |
| Jamaicans | 11.7 /100 | #215 | Poor 29.9% |
| Immigrants | Western Africa | 11.5 /100 | #216 | Poor 29.9% |
| Immigrants | Ghana | 11.3 /100 | #217 | Poor 29.9% |
| Hungarians | 10.3 /100 | #218 | Poor 29.9% |
| Finns | 9.3 /100 | #219 | Tragic 30.0% |
| Germans | 8.8 /100 | #220 | Tragic 30.0% |
| Immigrants | Eritrea | 7.7 /100 | #221 | Tragic 30.0% |
| Sudanese | 7.6 /100 | #222 | Tragic 30.0% |
| Immigrants | Cuba | 6.9 /100 | #223 | Tragic 30.1% |
| Immigrants | Sudan | 6.5 /100 | #224 | Tragic 30.1% |
| Spanish | 6.3 /100 | #225 | Tragic 30.1% |
| Scottish | 6.0 /100 | #226 | Tragic 30.1% |
Demographics Similar to British West Indians by Single Mother Poverty
In terms of single mother poverty, the demographic groups most similar to British West Indians are Scotch-Irish (31.5%, a difference of 0.050%), Immigrants from Senegal (31.5%, a difference of 0.090%), Immigrants from Cabo Verde (31.6%, a difference of 0.24%), Immigrants from Micronesia (31.6%, a difference of 0.26%), and Immigrants from Belize (31.4%, a difference of 0.27%).
| Demographics | Rating | Rank | Single Mother Poverty |
| Bahamians | 0.2 /100 | #263 | Tragic 31.3% |
| Immigrants | Ecuador | 0.2 /100 | #264 | Tragic 31.3% |
| German Russians | 0.2 /100 | #265 | Tragic 31.3% |
| Sub-Saharan Africans | 0.2 /100 | #266 | Tragic 31.4% |
| Immigrants | Belize | 0.2 /100 | #267 | Tragic 31.4% |
| Immigrants | Senegal | 0.1 /100 | #268 | Tragic 31.5% |
| Scotch-Irish | 0.1 /100 | #269 | Tragic 31.5% |
| British West Indians | 0.1 /100 | #270 | Tragic 31.5% |
| Immigrants | Cabo Verde | 0.1 /100 | #271 | Tragic 31.6% |
| Immigrants | Micronesia | 0.1 /100 | #272 | Tragic 31.6% |
| Fijians | 0.1 /100 | #273 | Tragic 31.6% |
| Bangladeshis | 0.1 /100 | #274 | Tragic 31.7% |
| Central Americans | 0.1 /100 | #275 | Tragic 31.8% |
| Delaware | 0.0 /100 | #276 | Tragic 31.8% |
| Mexican American Indians | 0.0 /100 | #277 | Tragic 31.9% |