Creek vs Soviet Union Family Poverty
COMPARE
Creek
Soviet Union
Family Poverty
Family Poverty Comparison
Creek
Soviet Union
11.7%
FAMILY POVERTY
0.0/ 100
METRIC RATING
297th/ 347
METRIC RANK
8.3%
FAMILY POVERTY
90.8/ 100
METRIC RATING
124th/ 347
METRIC RANK
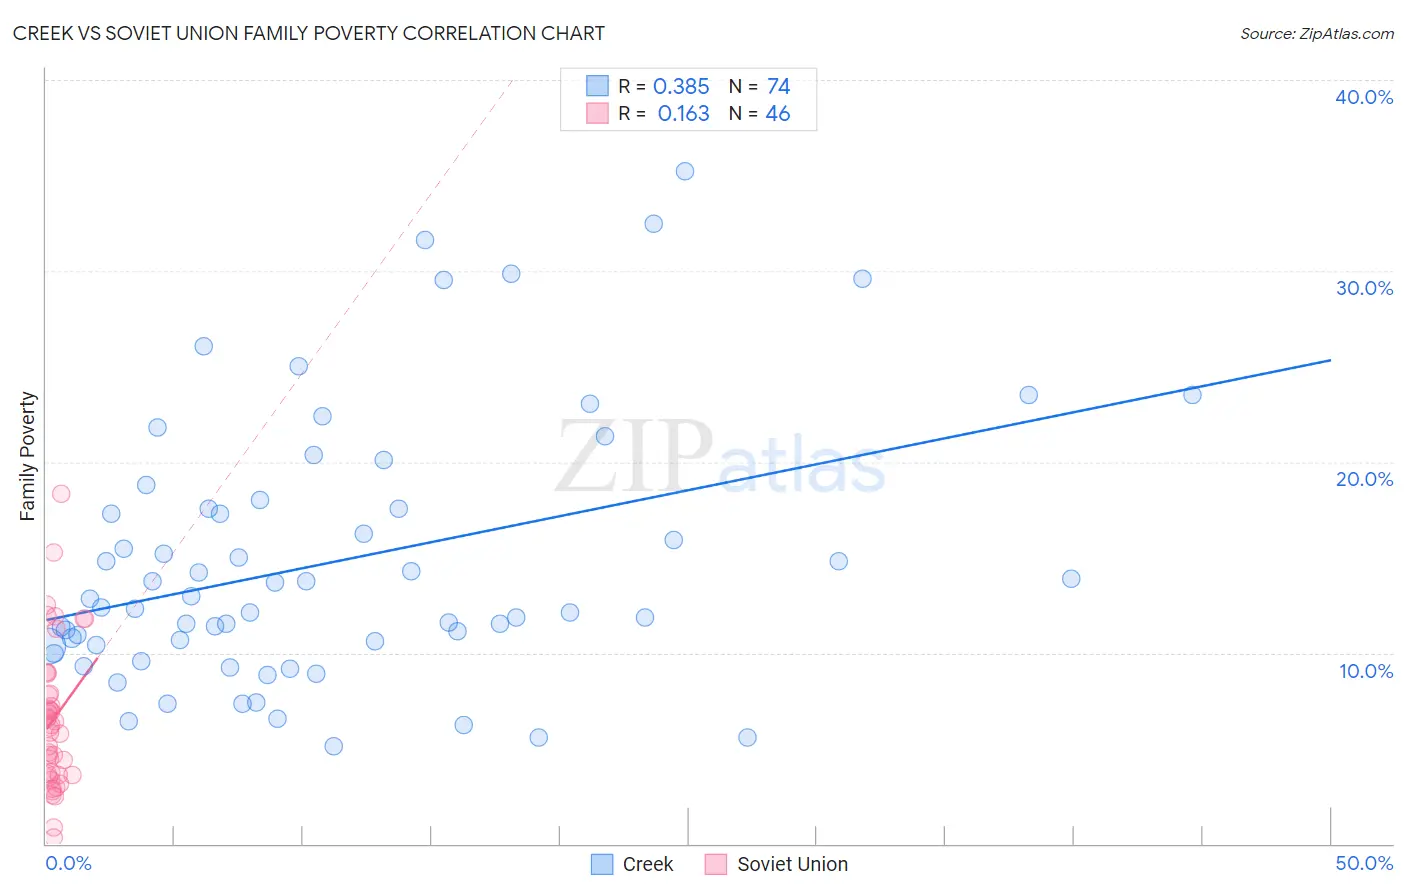
Creek vs Soviet Union Family Poverty Correlation Chart
The statistical analysis conducted on geographies consisting of 178,327,636 people shows a mild positive correlation between the proportion of Creek and poverty level among families in the United States with a correlation coefficient (R) of 0.385 and weighted average of 11.7%. Similarly, the statistical analysis conducted on geographies consisting of 43,439,449 people shows a poor positive correlation between the proportion of Soviet Union and poverty level among families in the United States with a correlation coefficient (R) of 0.163 and weighted average of 8.3%, a difference of 39.9%.
Family Poverty Correlation Summary
| Measurement | Creek | Soviet Union |
| Minimum | 5.1% | 0.36% |
| Maximum | 35.2% | 18.3% |
| Range | 30.1% | 18.0% |
| Mean | 14.8% | 6.5% |
| Median | 12.6% | 6.2% |
| Interquartile 25% (IQ1) | 10.4% | 3.6% |
| Interquartile 75% (IQ3) | 17.6% | 7.9% |
| Interquartile Range (IQR) | 7.2% | 4.2% |
| Standard Deviation (Sample) | 7.0% | 3.8% |
| Standard Deviation (Population) | 6.9% | 3.7% |
Similar Demographics by Family Poverty
Demographics Similar to Creek by Family Poverty
In terms of family poverty, the demographic groups most similar to Creek are Immigrants from Senegal (11.7%, a difference of 0.14%), Choctaw (11.6%, a difference of 0.23%), Dutch West Indian (11.7%, a difference of 0.24%), Immigrants from Bangladesh (11.7%, a difference of 0.25%), and Immigrants from Haiti (11.6%, a difference of 0.28%).
| Demographics | Rating | Rank | Family Poverty |
| West Indians | 0.0 /100 | #290 | Tragic 11.5% |
| Haitians | 0.0 /100 | #291 | Tragic 11.5% |
| Immigrants | Somalia | 0.0 /100 | #292 | Tragic 11.5% |
| Immigrants | Cabo Verde | 0.0 /100 | #293 | Tragic 11.6% |
| Immigrants | St. Vincent and the Grenadines | 0.0 /100 | #294 | Tragic 11.6% |
| Immigrants | Haiti | 0.0 /100 | #295 | Tragic 11.6% |
| Choctaw | 0.0 /100 | #296 | Tragic 11.6% |
| Creek | 0.0 /100 | #297 | Tragic 11.7% |
| Immigrants | Senegal | 0.0 /100 | #298 | Tragic 11.7% |
| Dutch West Indians | 0.0 /100 | #299 | Tragic 11.7% |
| Immigrants | Bangladesh | 0.0 /100 | #300 | Tragic 11.7% |
| Bahamians | 0.0 /100 | #301 | Tragic 11.7% |
| Guatemalans | 0.0 /100 | #302 | Tragic 11.7% |
| Africans | 0.0 /100 | #303 | Tragic 11.8% |
| Immigrants | Latin America | 0.0 /100 | #304 | Tragic 11.8% |
Demographics Similar to Soviet Union by Family Poverty
In terms of family poverty, the demographic groups most similar to Soviet Union are Pakistani (8.3%, a difference of 0.040%), Palestinian (8.3%, a difference of 0.10%), Paraguayan (8.3%, a difference of 0.17%), Native Hawaiian (8.3%, a difference of 0.18%), and Icelander (8.3%, a difference of 0.24%).
| Demographics | Rating | Rank | Family Poverty |
| Immigrants | Russia | 93.2 /100 | #117 | Exceptional 8.2% |
| Immigrants | Western Europe | 92.9 /100 | #118 | Exceptional 8.2% |
| French | 92.8 /100 | #119 | Exceptional 8.3% |
| Immigrants | Egypt | 91.6 /100 | #120 | Exceptional 8.3% |
| Native Hawaiians | 91.3 /100 | #121 | Exceptional 8.3% |
| Paraguayans | 91.2 /100 | #122 | Exceptional 8.3% |
| Palestinians | 91.1 /100 | #123 | Exceptional 8.3% |
| Soviet Union | 90.8 /100 | #124 | Exceptional 8.3% |
| Pakistanis | 90.8 /100 | #125 | Exceptional 8.3% |
| Icelanders | 90.3 /100 | #126 | Exceptional 8.3% |
| Immigrants | Hungary | 89.9 /100 | #127 | Excellent 8.4% |
| Argentineans | 89.6 /100 | #128 | Excellent 8.4% |
| Portuguese | 89.2 /100 | #129 | Excellent 8.4% |
| Immigrants | Bosnia and Herzegovina | 88.6 /100 | #130 | Excellent 8.4% |
| Puget Sound Salish | 88.6 /100 | #131 | Excellent 8.4% |