Creek vs Immigrants from Morocco Family Poverty
COMPARE
Creek
Immigrants from Morocco
Family Poverty
Family Poverty Comparison
Creek
Immigrants from Morocco
11.7%
FAMILY POVERTY
0.0/ 100
METRIC RATING
297th/ 347
METRIC RANK
9.1%
FAMILY POVERTY
40.2/ 100
METRIC RATING
182nd/ 347
METRIC RANK
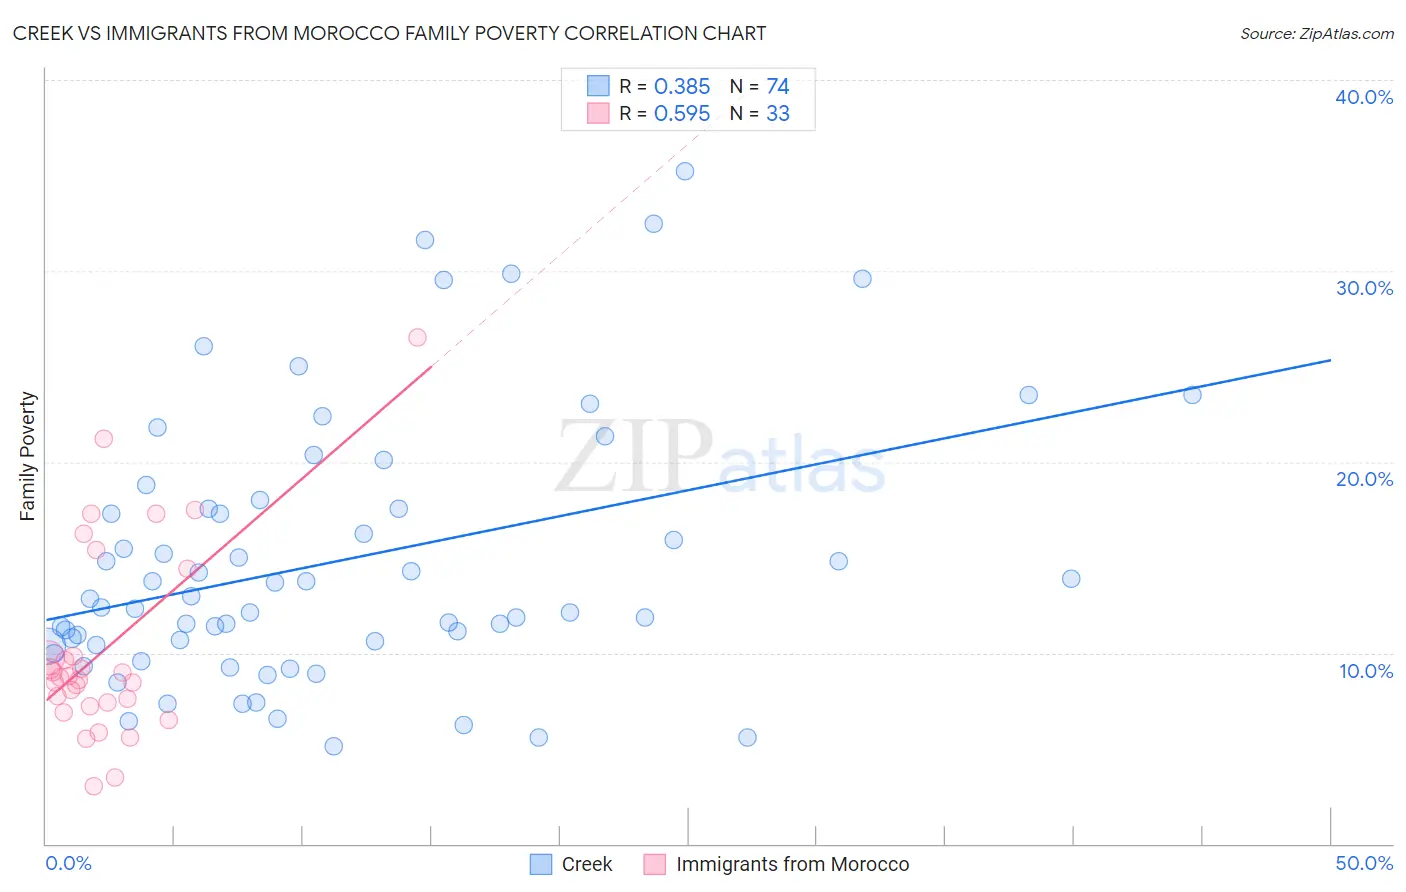
Creek vs Immigrants from Morocco Family Poverty Correlation Chart
The statistical analysis conducted on geographies consisting of 178,327,636 people shows a mild positive correlation between the proportion of Creek and poverty level among families in the United States with a correlation coefficient (R) of 0.385 and weighted average of 11.7%. Similarly, the statistical analysis conducted on geographies consisting of 178,782,527 people shows a substantial positive correlation between the proportion of Immigrants from Morocco and poverty level among families in the United States with a correlation coefficient (R) of 0.595 and weighted average of 9.1%, a difference of 27.7%.
Family Poverty Correlation Summary
| Measurement | Creek | Immigrants from Morocco |
| Minimum | 5.1% | 3.0% |
| Maximum | 35.2% | 26.5% |
| Range | 30.1% | 23.5% |
| Mean | 14.8% | 10.2% |
| Median | 12.6% | 8.7% |
| Interquartile 25% (IQ1) | 10.4% | 7.3% |
| Interquartile 75% (IQ3) | 17.6% | 12.1% |
| Interquartile Range (IQR) | 7.2% | 4.8% |
| Standard Deviation (Sample) | 7.0% | 5.2% |
| Standard Deviation (Population) | 6.9% | 5.1% |
Similar Demographics by Family Poverty
Demographics Similar to Creek by Family Poverty
In terms of family poverty, the demographic groups most similar to Creek are Immigrants from Senegal (11.7%, a difference of 0.14%), Choctaw (11.6%, a difference of 0.23%), Dutch West Indian (11.7%, a difference of 0.24%), Immigrants from Bangladesh (11.7%, a difference of 0.25%), and Immigrants from Haiti (11.6%, a difference of 0.28%).
| Demographics | Rating | Rank | Family Poverty |
| West Indians | 0.0 /100 | #290 | Tragic 11.5% |
| Haitians | 0.0 /100 | #291 | Tragic 11.5% |
| Immigrants | Somalia | 0.0 /100 | #292 | Tragic 11.5% |
| Immigrants | Cabo Verde | 0.0 /100 | #293 | Tragic 11.6% |
| Immigrants | St. Vincent and the Grenadines | 0.0 /100 | #294 | Tragic 11.6% |
| Immigrants | Haiti | 0.0 /100 | #295 | Tragic 11.6% |
| Choctaw | 0.0 /100 | #296 | Tragic 11.6% |
| Creek | 0.0 /100 | #297 | Tragic 11.7% |
| Immigrants | Senegal | 0.0 /100 | #298 | Tragic 11.7% |
| Dutch West Indians | 0.0 /100 | #299 | Tragic 11.7% |
| Immigrants | Bangladesh | 0.0 /100 | #300 | Tragic 11.7% |
| Bahamians | 0.0 /100 | #301 | Tragic 11.7% |
| Guatemalans | 0.0 /100 | #302 | Tragic 11.7% |
| Africans | 0.0 /100 | #303 | Tragic 11.8% |
| Immigrants | Latin America | 0.0 /100 | #304 | Tragic 11.8% |
Demographics Similar to Immigrants from Morocco by Family Poverty
In terms of family poverty, the demographic groups most similar to Immigrants from Morocco are Hmong (9.1%, a difference of 0.010%), Uruguayan (9.1%, a difference of 0.13%), South American Indian (9.1%, a difference of 0.20%), Immigrants from Saudi Arabia (9.1%, a difference of 0.21%), and Immigrants from Uganda (9.1%, a difference of 0.43%).
| Demographics | Rating | Rank | Family Poverty |
| Costa Ricans | 49.3 /100 | #175 | Average 9.0% |
| Immigrants | Syria | 47.5 /100 | #176 | Average 9.0% |
| Hawaiians | 47.2 /100 | #177 | Average 9.0% |
| Immigrants | Cameroon | 47.1 /100 | #178 | Average 9.0% |
| Immigrants | Iraq | 44.4 /100 | #179 | Average 9.1% |
| Immigrants | Uganda | 43.4 /100 | #180 | Average 9.1% |
| Hmong | 40.2 /100 | #181 | Average 9.1% |
| Immigrants | Morocco | 40.2 /100 | #182 | Average 9.1% |
| Uruguayans | 39.2 /100 | #183 | Fair 9.1% |
| South American Indians | 38.7 /100 | #184 | Fair 9.1% |
| Immigrants | Saudi Arabia | 38.6 /100 | #185 | Fair 9.1% |
| Colombians | 36.1 /100 | #186 | Fair 9.2% |
| Delaware | 35.4 /100 | #187 | Fair 9.2% |
| Immigrants | Kenya | 34.0 /100 | #188 | Fair 9.2% |
| Immigrants | Afghanistan | 32.1 /100 | #189 | Fair 9.2% |