Creek vs Immigrants from Netherlands Family Poverty
COMPARE
Creek
Immigrants from Netherlands
Family Poverty
Family Poverty Comparison
Creek
Immigrants from Netherlands
11.7%
FAMILY POVERTY
0.0/ 100
METRIC RATING
297th/ 347
METRIC RANK
7.7%
FAMILY POVERTY
98.6/ 100
METRIC RATING
61st/ 347
METRIC RANK
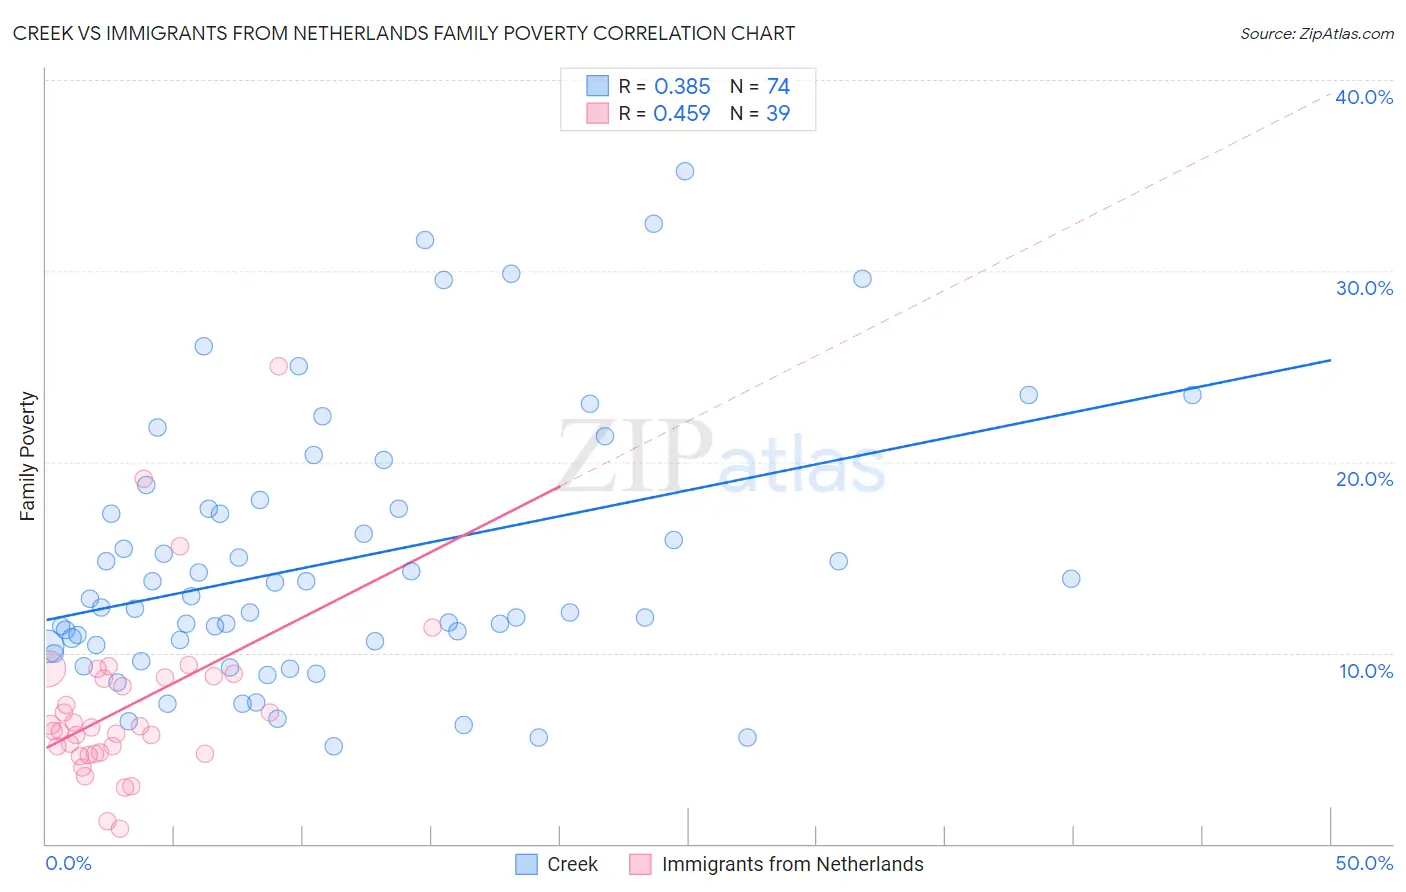
Creek vs Immigrants from Netherlands Family Poverty Correlation Chart
The statistical analysis conducted on geographies consisting of 178,327,636 people shows a mild positive correlation between the proportion of Creek and poverty level among families in the United States with a correlation coefficient (R) of 0.385 and weighted average of 11.7%. Similarly, the statistical analysis conducted on geographies consisting of 237,430,105 people shows a moderate positive correlation between the proportion of Immigrants from Netherlands and poverty level among families in the United States with a correlation coefficient (R) of 0.459 and weighted average of 7.7%, a difference of 50.4%.
Family Poverty Correlation Summary
| Measurement | Creek | Immigrants from Netherlands |
| Minimum | 5.1% | 0.78% |
| Maximum | 35.2% | 25.0% |
| Range | 30.1% | 24.2% |
| Mean | 14.8% | 7.2% |
| Median | 12.6% | 6.1% |
| Interquartile 25% (IQ1) | 10.4% | 4.7% |
| Interquartile 75% (IQ3) | 17.6% | 8.7% |
| Interquartile Range (IQR) | 7.2% | 4.0% |
| Standard Deviation (Sample) | 7.0% | 4.5% |
| Standard Deviation (Population) | 6.9% | 4.4% |
Similar Demographics by Family Poverty
Demographics Similar to Creek by Family Poverty
In terms of family poverty, the demographic groups most similar to Creek are Immigrants from Senegal (11.7%, a difference of 0.14%), Choctaw (11.6%, a difference of 0.23%), Dutch West Indian (11.7%, a difference of 0.24%), Immigrants from Bangladesh (11.7%, a difference of 0.25%), and Immigrants from Haiti (11.6%, a difference of 0.28%).
| Demographics | Rating | Rank | Family Poverty |
| West Indians | 0.0 /100 | #290 | Tragic 11.5% |
| Haitians | 0.0 /100 | #291 | Tragic 11.5% |
| Immigrants | Somalia | 0.0 /100 | #292 | Tragic 11.5% |
| Immigrants | Cabo Verde | 0.0 /100 | #293 | Tragic 11.6% |
| Immigrants | St. Vincent and the Grenadines | 0.0 /100 | #294 | Tragic 11.6% |
| Immigrants | Haiti | 0.0 /100 | #295 | Tragic 11.6% |
| Choctaw | 0.0 /100 | #296 | Tragic 11.6% |
| Creek | 0.0 /100 | #297 | Tragic 11.7% |
| Immigrants | Senegal | 0.0 /100 | #298 | Tragic 11.7% |
| Dutch West Indians | 0.0 /100 | #299 | Tragic 11.7% |
| Immigrants | Bangladesh | 0.0 /100 | #300 | Tragic 11.7% |
| Bahamians | 0.0 /100 | #301 | Tragic 11.7% |
| Guatemalans | 0.0 /100 | #302 | Tragic 11.7% |
| Africans | 0.0 /100 | #303 | Tragic 11.8% |
| Immigrants | Latin America | 0.0 /100 | #304 | Tragic 11.8% |
Demographics Similar to Immigrants from Netherlands by Family Poverty
In terms of family poverty, the demographic groups most similar to Immigrants from Netherlands are Immigrants from Greece (7.7%, a difference of 0.18%), European (7.7%, a difference of 0.19%), Macedonian (7.8%, a difference of 0.19%), Finnish (7.7%, a difference of 0.20%), and Asian (7.7%, a difference of 0.23%).
| Demographics | Rating | Rank | Family Poverty |
| Immigrants | Sweden | 98.8 /100 | #54 | Exceptional 7.7% |
| Immigrants | Eastern Asia | 98.7 /100 | #55 | Exceptional 7.7% |
| Immigrants | Serbia | 98.7 /100 | #56 | Exceptional 7.7% |
| Asians | 98.7 /100 | #57 | Exceptional 7.7% |
| Finns | 98.7 /100 | #58 | Exceptional 7.7% |
| Europeans | 98.7 /100 | #59 | Exceptional 7.7% |
| Immigrants | Greece | 98.7 /100 | #60 | Exceptional 7.7% |
| Immigrants | Netherlands | 98.6 /100 | #61 | Exceptional 7.7% |
| Macedonians | 98.6 /100 | #62 | Exceptional 7.8% |
| Zimbabweans | 98.4 /100 | #63 | Exceptional 7.8% |
| Koreans | 98.3 /100 | #64 | Exceptional 7.8% |
| Immigrants | Bulgaria | 98.3 /100 | #65 | Exceptional 7.8% |
| Dutch | 98.3 /100 | #66 | Exceptional 7.8% |
| Northern Europeans | 98.3 /100 | #67 | Exceptional 7.8% |
| Australians | 98.2 /100 | #68 | Exceptional 7.8% |