Creek vs Trinidadian and Tobagonian Poverty
COMPARE
Creek
Trinidadian and Tobagonian
Poverty
Poverty Comparison
Creek
Trinidadians and Tobagonians
15.6%
POVERTY
0.0/ 100
METRIC RATING
306th/ 347
METRIC RANK
14.3%
POVERTY
0.1/ 100
METRIC RATING
257th/ 347
METRIC RANK
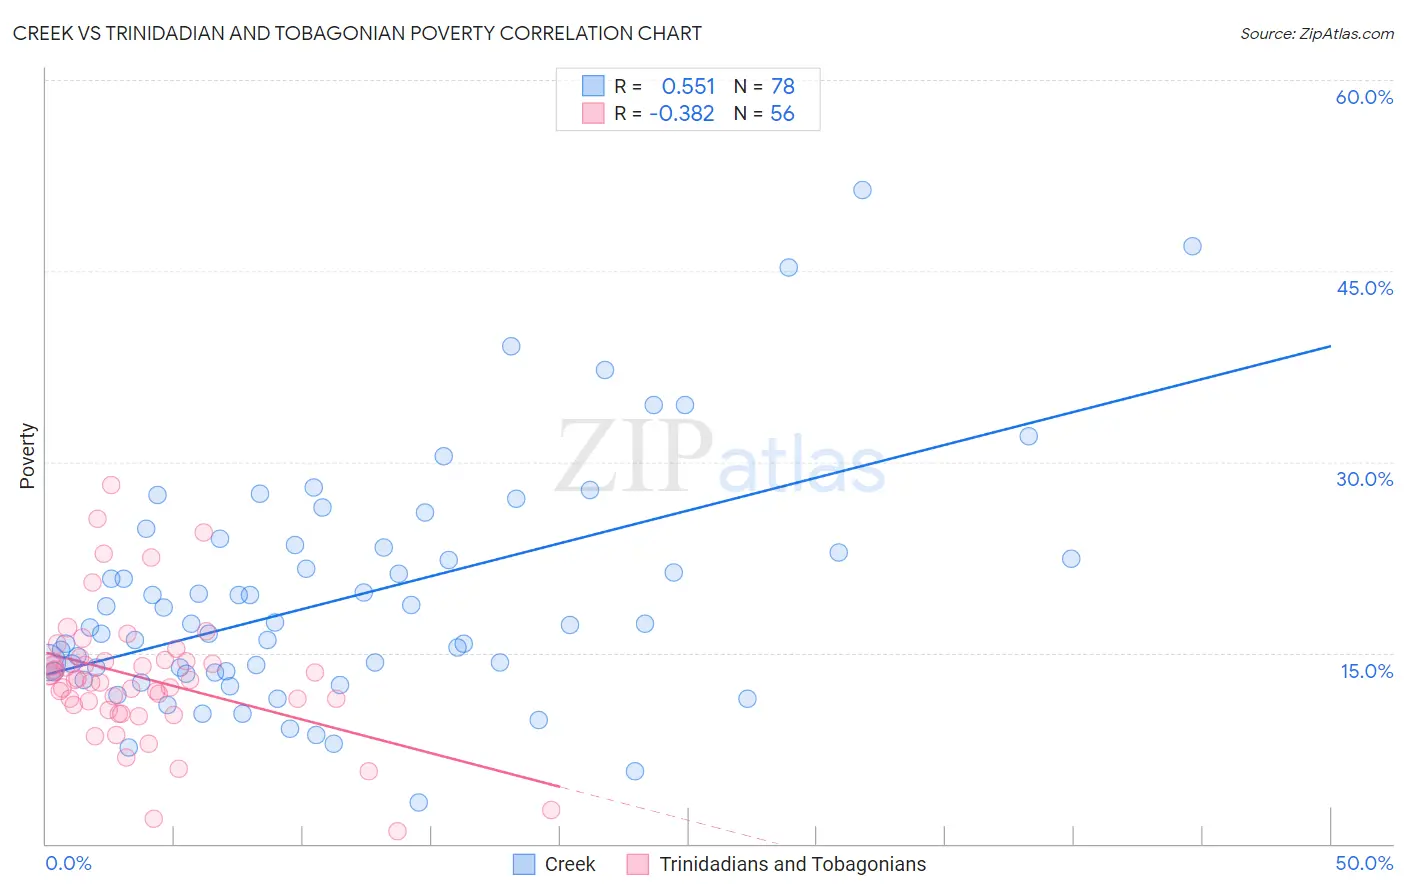
Creek vs Trinidadian and Tobagonian Poverty Correlation Chart
The statistical analysis conducted on geographies consisting of 178,440,498 people shows a substantial positive correlation between the proportion of Creek and poverty level in the United States with a correlation coefficient (R) of 0.551 and weighted average of 15.6%. Similarly, the statistical analysis conducted on geographies consisting of 219,718,536 people shows a mild negative correlation between the proportion of Trinidadians and Tobagonians and poverty level in the United States with a correlation coefficient (R) of -0.382 and weighted average of 14.3%, a difference of 8.9%.
Poverty Correlation Summary
| Measurement | Creek | Trinidadian and Tobagonian |
| Minimum | 3.2% | 1.0% |
| Maximum | 51.4% | 28.1% |
| Range | 48.1% | 27.1% |
| Mean | 19.4% | 13.0% |
| Median | 17.2% | 12.8% |
| Interquartile 25% (IQ1) | 13.5% | 10.7% |
| Interquartile 75% (IQ3) | 23.3% | 14.4% |
| Interquartile Range (IQR) | 9.7% | 3.7% |
| Standard Deviation (Sample) | 9.2% | 5.2% |
| Standard Deviation (Population) | 9.2% | 5.1% |
Similar Demographics by Poverty
Demographics Similar to Creek by Poverty
In terms of poverty, the demographic groups most similar to Creek are African (15.6%, a difference of 0.070%), Choctaw (15.6%, a difference of 0.18%), Seminole (15.6%, a difference of 0.23%), Dutch West Indian (15.6%, a difference of 0.32%), and Immigrants from Guatemala (15.5%, a difference of 0.44%).
| Demographics | Rating | Rank | Poverty |
| Senegalese | 0.0 /100 | #299 | Tragic 15.3% |
| Immigrants | Central America | 0.0 /100 | #300 | Tragic 15.4% |
| Bahamians | 0.0 /100 | #301 | Tragic 15.4% |
| Somalis | 0.0 /100 | #302 | Tragic 15.4% |
| Immigrants | Caribbean | 0.0 /100 | #303 | Tragic 15.5% |
| Immigrants | Mexico | 0.0 /100 | #304 | Tragic 15.5% |
| Immigrants | Guatemala | 0.0 /100 | #305 | Tragic 15.5% |
| Creek | 0.0 /100 | #306 | Tragic 15.6% |
| Africans | 0.0 /100 | #307 | Tragic 15.6% |
| Choctaw | 0.0 /100 | #308 | Tragic 15.6% |
| Seminole | 0.0 /100 | #309 | Tragic 15.6% |
| Dutch West Indians | 0.0 /100 | #310 | Tragic 15.6% |
| Chippewa | 0.0 /100 | #311 | Tragic 15.7% |
| Cajuns | 0.0 /100 | #312 | Tragic 15.7% |
| Immigrants | Grenada | 0.0 /100 | #313 | Tragic 15.8% |
Demographics Similar to Trinidadians and Tobagonians by Poverty
In terms of poverty, the demographic groups most similar to Trinidadians and Tobagonians are Ottawa (14.3%, a difference of 0.010%), Mexican American Indian (14.3%, a difference of 0.040%), Immigrants from Ecuador (14.3%, a difference of 0.060%), Immigrants from El Salvador (14.3%, a difference of 0.16%), and Immigrants from Nicaragua (14.3%, a difference of 0.28%).
| Demographics | Rating | Rank | Poverty |
| Cree | 0.2 /100 | #250 | Tragic 14.2% |
| Immigrants | Burma/Myanmar | 0.2 /100 | #251 | Tragic 14.2% |
| Spanish American Indians | 0.2 /100 | #252 | Tragic 14.2% |
| Immigrants | Trinidad and Tobago | 0.2 /100 | #253 | Tragic 14.2% |
| Immigrants | El Salvador | 0.1 /100 | #254 | Tragic 14.3% |
| Immigrants | Ecuador | 0.1 /100 | #255 | Tragic 14.3% |
| Mexican American Indians | 0.1 /100 | #256 | Tragic 14.3% |
| Trinidadians and Tobagonians | 0.1 /100 | #257 | Tragic 14.3% |
| Ottawa | 0.1 /100 | #258 | Tragic 14.3% |
| Immigrants | Nicaragua | 0.1 /100 | #259 | Tragic 14.3% |
| Cape Verdeans | 0.1 /100 | #260 | Tragic 14.4% |
| Cherokee | 0.1 /100 | #261 | Tragic 14.4% |
| Immigrants | Liberia | 0.1 /100 | #262 | Tragic 14.4% |
| Jamaicans | 0.1 /100 | #263 | Tragic 14.4% |
| Immigrants | Jamaica | 0.1 /100 | #264 | Tragic 14.4% |