Cree vs Osage Single Male Poverty
COMPARE
Cree
Osage
Single Male Poverty
Single Male Poverty Comparison
Cree
Osage
15.1%
SINGLE MALE POVERTY
0.0/ 100
METRIC RATING
300th/ 347
METRIC RANK
16.5%
SINGLE MALE POVERTY
0.0/ 100
METRIC RATING
321st/ 347
METRIC RANK
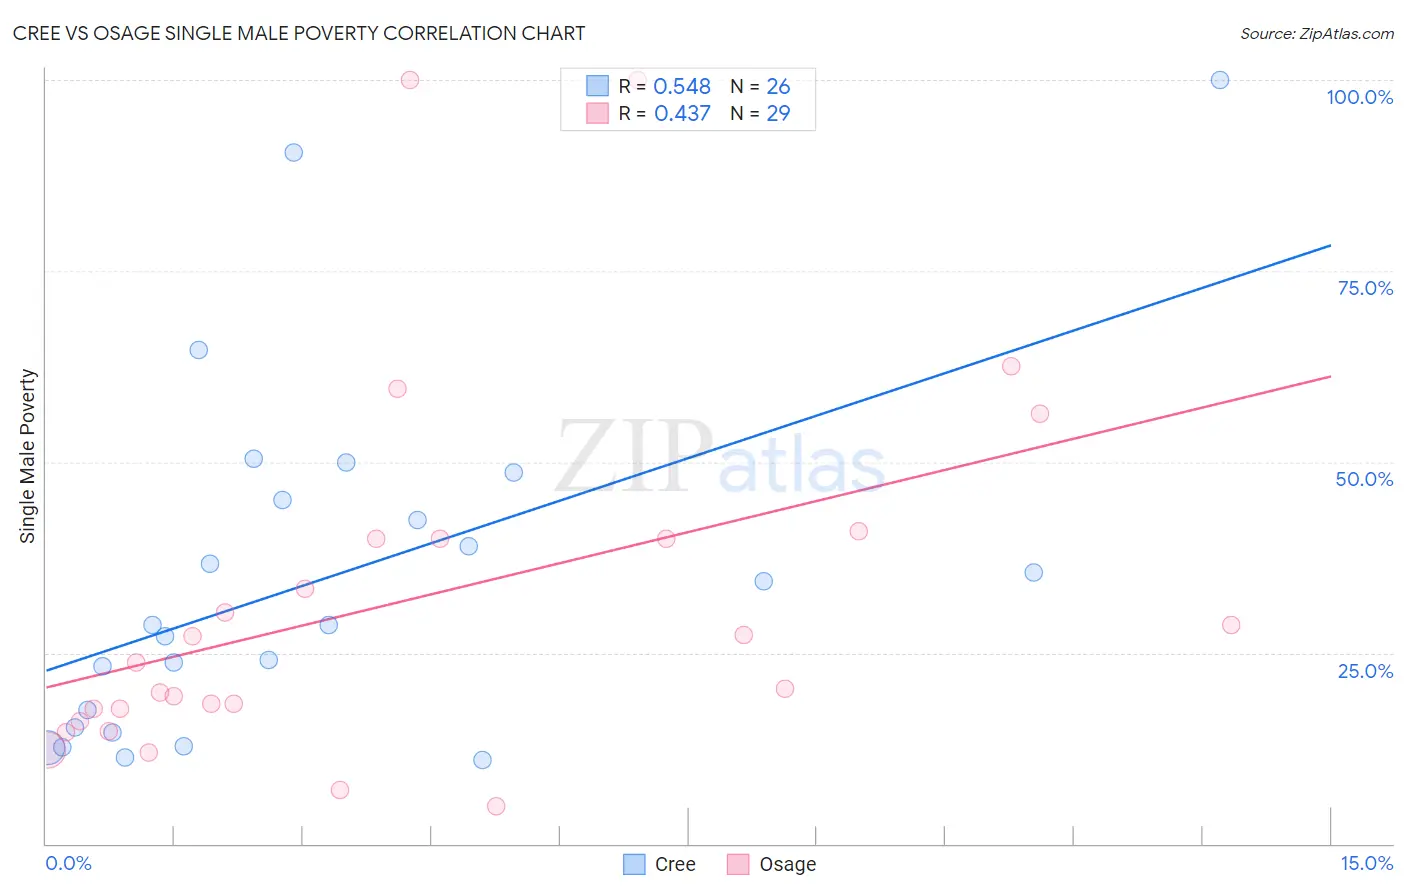
Cree vs Osage Single Male Poverty Correlation Chart
The statistical analysis conducted on geographies consisting of 73,575,391 people shows a substantial positive correlation between the proportion of Cree and poverty level among single males in the United States with a correlation coefficient (R) of 0.548 and weighted average of 15.1%. Similarly, the statistical analysis conducted on geographies consisting of 87,587,587 people shows a moderate positive correlation between the proportion of Osage and poverty level among single males in the United States with a correlation coefficient (R) of 0.437 and weighted average of 16.5%, a difference of 9.1%.
Single Male Poverty Correlation Summary
| Measurement | Cree | Osage |
| Minimum | 11.0% | 5.0% |
| Maximum | 100.0% | 100.0% |
| Range | 89.0% | 95.0% |
| Mean | 34.6% | 31.8% |
| Median | 28.6% | 23.8% |
| Interquartile 25% (IQ1) | 15.2% | 16.9% |
| Interquartile 75% (IQ3) | 45.0% | 40.0% |
| Interquartile Range (IQR) | 29.8% | 23.1% |
| Standard Deviation (Sample) | 23.1% | 24.0% |
| Standard Deviation (Population) | 22.6% | 23.6% |
Similar Demographics by Single Male Poverty
Demographics Similar to Cree by Single Male Poverty
In terms of single male poverty, the demographic groups most similar to Cree are Delaware (15.0%, a difference of 0.45%), Dominican (15.2%, a difference of 0.82%), French American Indian (15.0%, a difference of 0.84%), Alsatian (15.2%, a difference of 0.98%), and Aleut (15.4%, a difference of 2.0%).
| Demographics | Rating | Rank | Single Male Poverty |
| French Canadians | 0.0 /100 | #293 | Tragic 14.6% |
| Ottawa | 0.0 /100 | #294 | Tragic 14.6% |
| Scotch-Irish | 0.0 /100 | #295 | Tragic 14.7% |
| Africans | 0.0 /100 | #296 | Tragic 14.7% |
| Immigrants | Dominican Republic | 0.0 /100 | #297 | Tragic 14.8% |
| French American Indians | 0.0 /100 | #298 | Tragic 15.0% |
| Delaware | 0.0 /100 | #299 | Tragic 15.0% |
| Cree | 0.0 /100 | #300 | Tragic 15.1% |
| Dominicans | 0.0 /100 | #301 | Tragic 15.2% |
| Alsatians | 0.0 /100 | #302 | Tragic 15.2% |
| Aleuts | 0.0 /100 | #303 | Tragic 15.4% |
| Alaska Natives | 0.0 /100 | #304 | Tragic 15.4% |
| Blackfeet | 0.0 /100 | #305 | Tragic 15.5% |
| Pennsylvania Germans | 0.0 /100 | #306 | Tragic 15.6% |
| Ute | 0.0 /100 | #307 | Tragic 15.7% |
Demographics Similar to Osage by Single Male Poverty
In terms of single male poverty, the demographic groups most similar to Osage are Marshallese (16.4%, a difference of 0.13%), Chippewa (16.4%, a difference of 0.61%), Chickasaw (16.3%, a difference of 0.91%), Shoshone (16.7%, a difference of 1.3%), and Black/African American (16.2%, a difference of 1.7%).
| Demographics | Rating | Rank | Single Male Poverty |
| Alaskan Athabascans | 0.0 /100 | #314 | Tragic 16.1% |
| Cheyenne | 0.0 /100 | #315 | Tragic 16.1% |
| Dutch West Indians | 0.0 /100 | #316 | Tragic 16.1% |
| Blacks/African Americans | 0.0 /100 | #317 | Tragic 16.2% |
| Chickasaw | 0.0 /100 | #318 | Tragic 16.3% |
| Chippewa | 0.0 /100 | #319 | Tragic 16.4% |
| Marshallese | 0.0 /100 | #320 | Tragic 16.4% |
| Osage | 0.0 /100 | #321 | Tragic 16.5% |
| Shoshone | 0.0 /100 | #322 | Tragic 16.7% |
| Creek | 0.0 /100 | #323 | Tragic 16.8% |
| Immigrants | Yemen | 0.0 /100 | #324 | Tragic 16.9% |
| Choctaw | 0.0 /100 | #325 | Tragic 17.0% |
| Central American Indians | 0.0 /100 | #326 | Tragic 17.2% |
| Menominee | 0.0 /100 | #327 | Tragic 17.7% |
| Kiowa | 0.0 /100 | #328 | Tragic 18.3% |