Cree vs West Indian Single Male Poverty
COMPARE
Cree
West Indian
Single Male Poverty
Single Male Poverty Comparison
Cree
West Indians
15.1%
SINGLE MALE POVERTY
0.0/ 100
METRIC RATING
300th/ 347
METRIC RANK
13.8%
SINGLE MALE POVERTY
0.2/ 100
METRIC RATING
264th/ 347
METRIC RANK
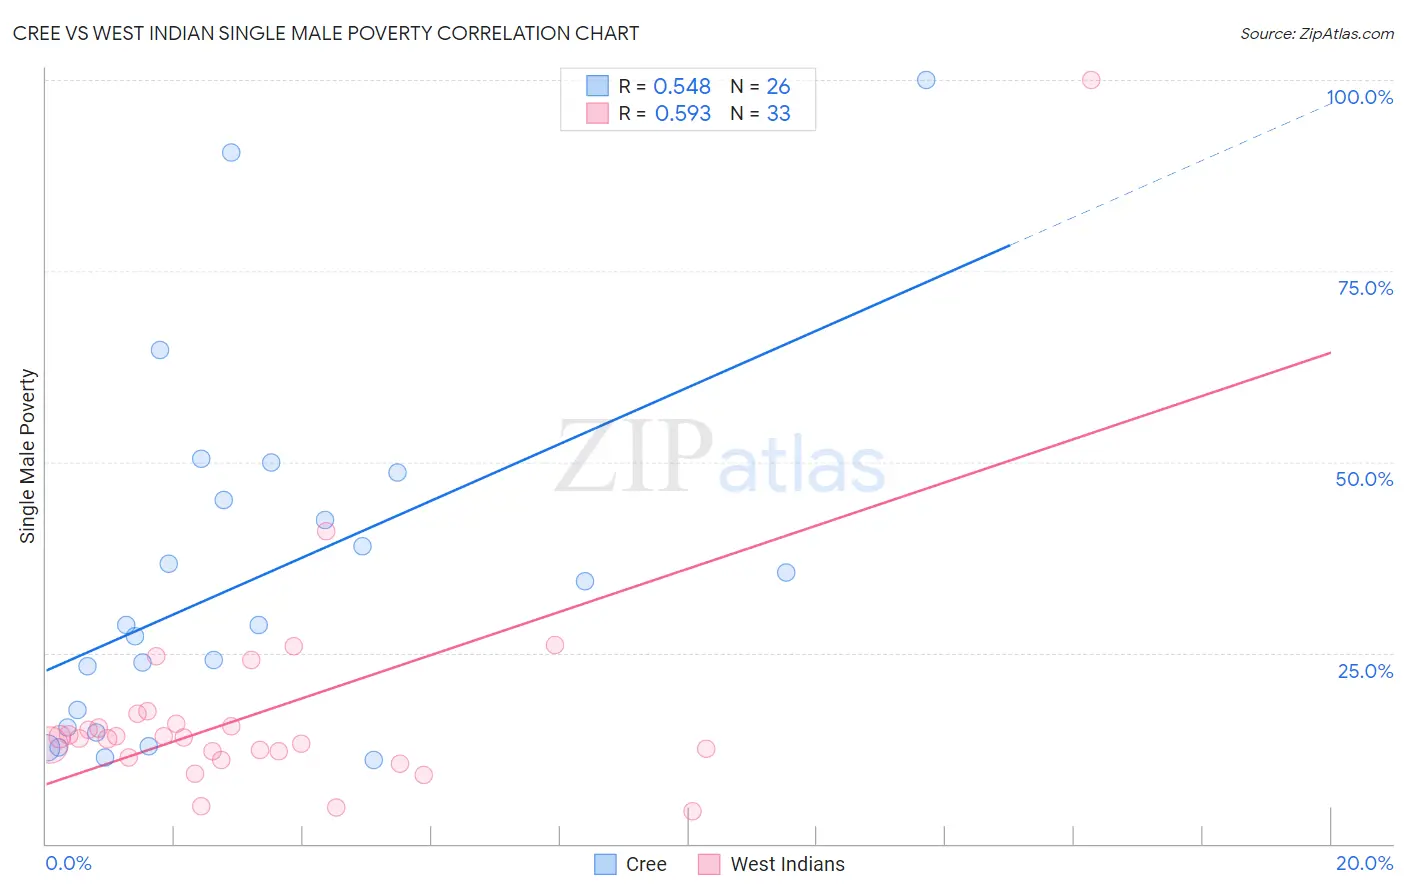
Cree vs West Indian Single Male Poverty Correlation Chart
The statistical analysis conducted on geographies consisting of 73,575,391 people shows a substantial positive correlation between the proportion of Cree and poverty level among single males in the United States with a correlation coefficient (R) of 0.548 and weighted average of 15.1%. Similarly, the statistical analysis conducted on geographies consisting of 236,137,868 people shows a substantial positive correlation between the proportion of West Indians and poverty level among single males in the United States with a correlation coefficient (R) of 0.593 and weighted average of 13.8%, a difference of 9.0%.
Single Male Poverty Correlation Summary
| Measurement | Cree | West Indian |
| Minimum | 11.0% | 4.3% |
| Maximum | 100.0% | 100.0% |
| Range | 89.0% | 95.7% |
| Mean | 34.6% | 17.4% |
| Median | 28.6% | 13.9% |
| Interquartile 25% (IQ1) | 15.2% | 11.6% |
| Interquartile 75% (IQ3) | 45.0% | 16.3% |
| Interquartile Range (IQR) | 29.8% | 4.7% |
| Standard Deviation (Sample) | 23.1% | 16.4% |
| Standard Deviation (Population) | 22.6% | 16.2% |
Similar Demographics by Single Male Poverty
Demographics Similar to Cree by Single Male Poverty
In terms of single male poverty, the demographic groups most similar to Cree are Delaware (15.0%, a difference of 0.45%), Dominican (15.2%, a difference of 0.82%), French American Indian (15.0%, a difference of 0.84%), Alsatian (15.2%, a difference of 0.98%), and Aleut (15.4%, a difference of 2.0%).
| Demographics | Rating | Rank | Single Male Poverty |
| French Canadians | 0.0 /100 | #293 | Tragic 14.6% |
| Ottawa | 0.0 /100 | #294 | Tragic 14.6% |
| Scotch-Irish | 0.0 /100 | #295 | Tragic 14.7% |
| Africans | 0.0 /100 | #296 | Tragic 14.7% |
| Immigrants | Dominican Republic | 0.0 /100 | #297 | Tragic 14.8% |
| French American Indians | 0.0 /100 | #298 | Tragic 15.0% |
| Delaware | 0.0 /100 | #299 | Tragic 15.0% |
| Cree | 0.0 /100 | #300 | Tragic 15.1% |
| Dominicans | 0.0 /100 | #301 | Tragic 15.2% |
| Alsatians | 0.0 /100 | #302 | Tragic 15.2% |
| Aleuts | 0.0 /100 | #303 | Tragic 15.4% |
| Alaska Natives | 0.0 /100 | #304 | Tragic 15.4% |
| Blackfeet | 0.0 /100 | #305 | Tragic 15.5% |
| Pennsylvania Germans | 0.0 /100 | #306 | Tragic 15.6% |
| Ute | 0.0 /100 | #307 | Tragic 15.7% |
Demographics Similar to West Indians by Single Male Poverty
In terms of single male poverty, the demographic groups most similar to West Indians are Immigrants from Congo (13.9%, a difference of 0.16%), Cape Verdean (13.8%, a difference of 0.19%), Fijian (13.8%, a difference of 0.31%), Immigrants from Cabo Verde (13.9%, a difference of 0.47%), and Hungarian (13.8%, a difference of 0.48%).
| Demographics | Rating | Rank | Single Male Poverty |
| Immigrants | Central America | 0.3 /100 | #257 | Tragic 13.8% |
| Immigrants | Guatemala | 0.3 /100 | #258 | Tragic 13.8% |
| Guatemalans | 0.3 /100 | #259 | Tragic 13.8% |
| Swiss | 0.3 /100 | #260 | Tragic 13.8% |
| Hungarians | 0.3 /100 | #261 | Tragic 13.8% |
| Fijians | 0.3 /100 | #262 | Tragic 13.8% |
| Cape Verdeans | 0.2 /100 | #263 | Tragic 13.8% |
| West Indians | 0.2 /100 | #264 | Tragic 13.8% |
| Immigrants | Congo | 0.2 /100 | #265 | Tragic 13.9% |
| Immigrants | Cabo Verde | 0.1 /100 | #266 | Tragic 13.9% |
| Germans | 0.1 /100 | #267 | Tragic 13.9% |
| Immigrants | Mexico | 0.1 /100 | #268 | Tragic 13.9% |
| Scottish | 0.1 /100 | #269 | Tragic 14.0% |
| Immigrants | Saudi Arabia | 0.1 /100 | #270 | Tragic 14.0% |
| Irish | 0.1 /100 | #271 | Tragic 14.0% |