Immigrants from Indonesia vs Osage Single Male Poverty
COMPARE
Immigrants from Indonesia
Osage
Single Male Poverty
Single Male Poverty Comparison
Immigrants from Indonesia
Osage
11.6%
SINGLE MALE POVERTY
99.9/ 100
METRIC RATING
48th/ 347
METRIC RANK
16.5%
SINGLE MALE POVERTY
0.0/ 100
METRIC RATING
321st/ 347
METRIC RANK
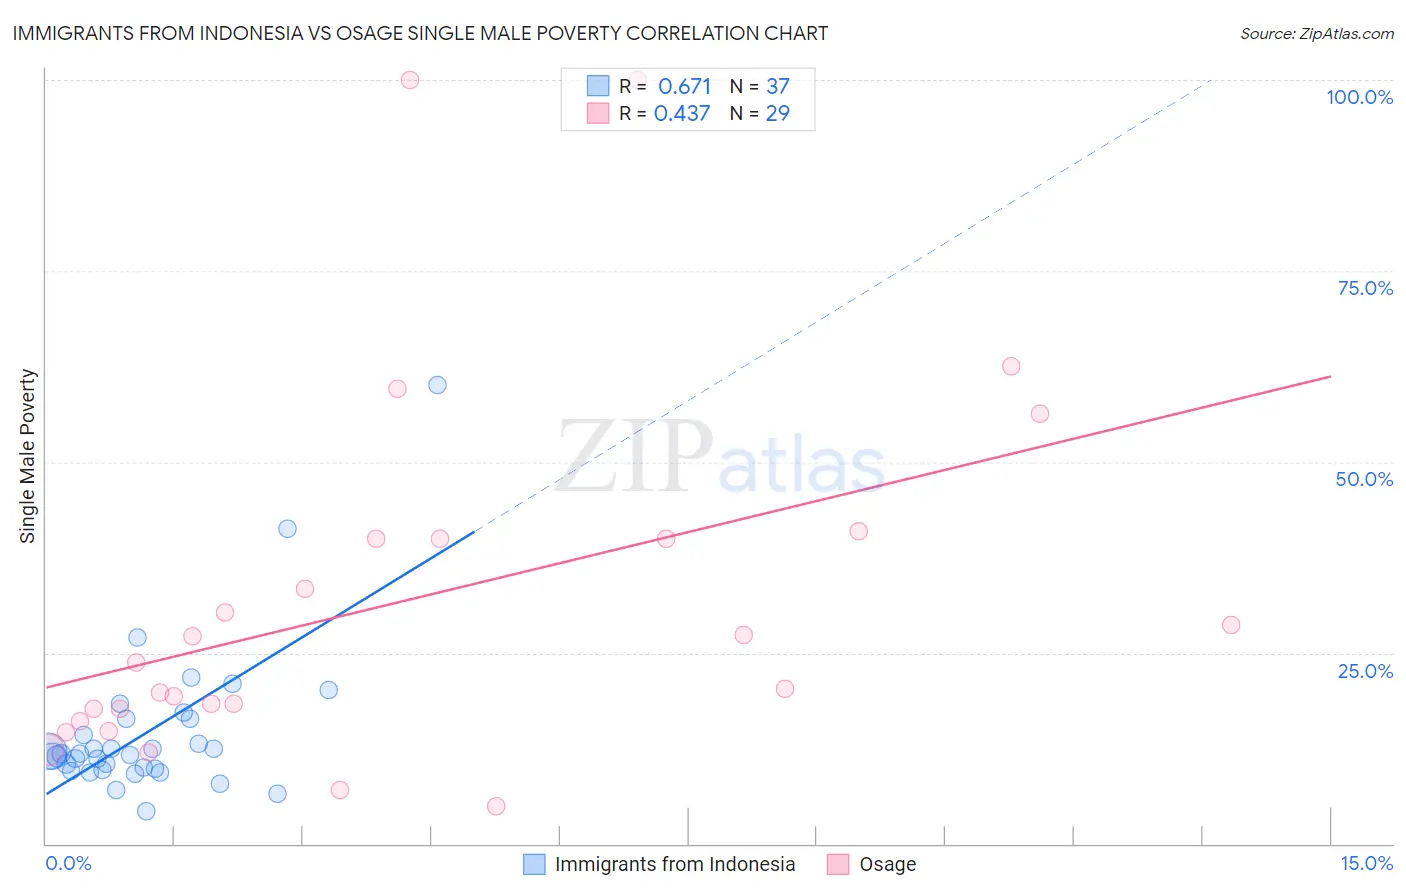
Immigrants from Indonesia vs Osage Single Male Poverty Correlation Chart
The statistical analysis conducted on geographies consisting of 200,544,788 people shows a significant positive correlation between the proportion of Immigrants from Indonesia and poverty level among single males in the United States with a correlation coefficient (R) of 0.671 and weighted average of 11.6%. Similarly, the statistical analysis conducted on geographies consisting of 87,587,587 people shows a moderate positive correlation between the proportion of Osage and poverty level among single males in the United States with a correlation coefficient (R) of 0.437 and weighted average of 16.5%, a difference of 42.0%.
Single Male Poverty Correlation Summary
| Measurement | Immigrants from Indonesia | Osage |
| Minimum | 4.3% | 5.0% |
| Maximum | 60.0% | 100.0% |
| Range | 55.7% | 95.0% |
| Mean | 14.7% | 31.8% |
| Median | 11.7% | 23.8% |
| Interquartile 25% (IQ1) | 9.8% | 16.9% |
| Interquartile 75% (IQ3) | 16.4% | 40.0% |
| Interquartile Range (IQR) | 6.6% | 23.1% |
| Standard Deviation (Sample) | 10.1% | 24.0% |
| Standard Deviation (Population) | 9.9% | 23.6% |
Similar Demographics by Single Male Poverty
Demographics Similar to Immigrants from Indonesia by Single Male Poverty
In terms of single male poverty, the demographic groups most similar to Immigrants from Indonesia are Tlingit-Haida (11.6%, a difference of 0.020%), Nepalese (11.6%, a difference of 0.080%), Immigrants from Lithuania (11.6%, a difference of 0.080%), Paraguayan (11.6%, a difference of 0.19%), and Immigrants from Bulgaria (11.6%, a difference of 0.27%).
| Demographics | Rating | Rank | Single Male Poverty |
| Immigrants | Iraq | 99.9 /100 | #41 | Exceptional 11.5% |
| Egyptians | 99.9 /100 | #42 | Exceptional 11.5% |
| Immigrants | Peru | 99.9 /100 | #43 | Exceptional 11.5% |
| Immigrants | Cameroon | 99.9 /100 | #44 | Exceptional 11.5% |
| Immigrants | Poland | 99.9 /100 | #45 | Exceptional 11.5% |
| Immigrants | Bulgaria | 99.9 /100 | #46 | Exceptional 11.6% |
| Nepalese | 99.9 /100 | #47 | Exceptional 11.6% |
| Immigrants | Indonesia | 99.9 /100 | #48 | Exceptional 11.6% |
| Tlingit-Haida | 99.9 /100 | #49 | Exceptional 11.6% |
| Immigrants | Lithuania | 99.9 /100 | #50 | Exceptional 11.6% |
| Paraguayans | 99.9 /100 | #51 | Exceptional 11.6% |
| Samoans | 99.9 /100 | #52 | Exceptional 11.7% |
| Bulgarians | 99.9 /100 | #53 | Exceptional 11.7% |
| Immigrants | Uzbekistan | 99.9 /100 | #54 | Exceptional 11.7% |
| Cypriots | 99.9 /100 | #55 | Exceptional 11.7% |
Demographics Similar to Osage by Single Male Poverty
In terms of single male poverty, the demographic groups most similar to Osage are Marshallese (16.4%, a difference of 0.13%), Chippewa (16.4%, a difference of 0.61%), Chickasaw (16.3%, a difference of 0.91%), Shoshone (16.7%, a difference of 1.3%), and Black/African American (16.2%, a difference of 1.7%).
| Demographics | Rating | Rank | Single Male Poverty |
| Alaskan Athabascans | 0.0 /100 | #314 | Tragic 16.1% |
| Cheyenne | 0.0 /100 | #315 | Tragic 16.1% |
| Dutch West Indians | 0.0 /100 | #316 | Tragic 16.1% |
| Blacks/African Americans | 0.0 /100 | #317 | Tragic 16.2% |
| Chickasaw | 0.0 /100 | #318 | Tragic 16.3% |
| Chippewa | 0.0 /100 | #319 | Tragic 16.4% |
| Marshallese | 0.0 /100 | #320 | Tragic 16.4% |
| Osage | 0.0 /100 | #321 | Tragic 16.5% |
| Shoshone | 0.0 /100 | #322 | Tragic 16.7% |
| Creek | 0.0 /100 | #323 | Tragic 16.8% |
| Immigrants | Yemen | 0.0 /100 | #324 | Tragic 16.9% |
| Choctaw | 0.0 /100 | #325 | Tragic 17.0% |
| Central American Indians | 0.0 /100 | #326 | Tragic 17.2% |
| Menominee | 0.0 /100 | #327 | Tragic 17.7% |
| Kiowa | 0.0 /100 | #328 | Tragic 18.3% |