Cree vs Immigrants from Greece Single Male Poverty
COMPARE
Cree
Immigrants from Greece
Single Male Poverty
Single Male Poverty Comparison
Cree
Immigrants from Greece
15.1%
SINGLE MALE POVERTY
0.0/ 100
METRIC RATING
300th/ 347
METRIC RANK
11.9%
SINGLE MALE POVERTY
99.6/ 100
METRIC RATING
71st/ 347
METRIC RANK
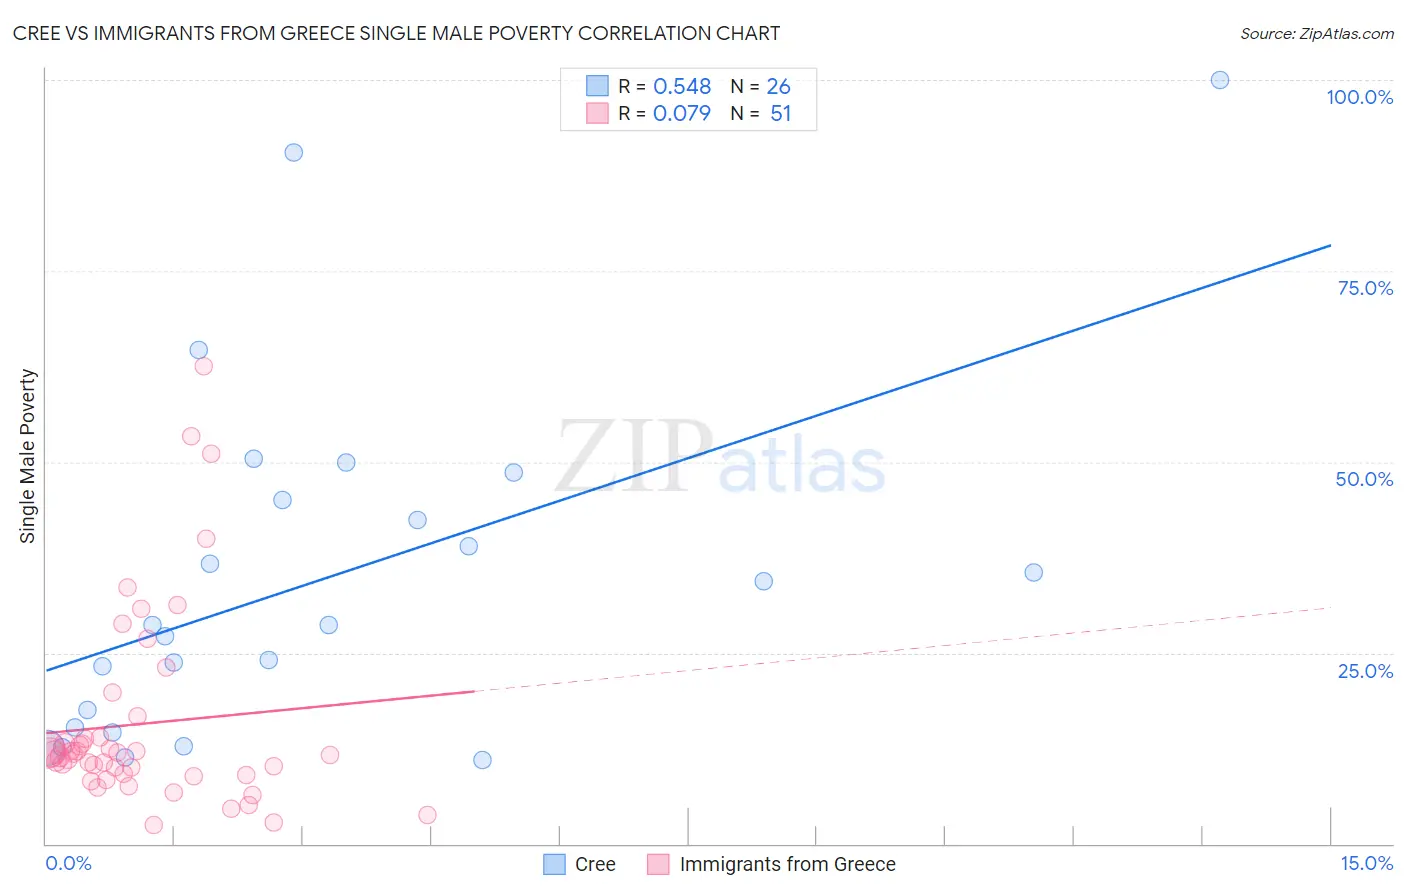
Cree vs Immigrants from Greece Single Male Poverty Correlation Chart
The statistical analysis conducted on geographies consisting of 73,575,391 people shows a substantial positive correlation between the proportion of Cree and poverty level among single males in the United States with a correlation coefficient (R) of 0.548 and weighted average of 15.1%. Similarly, the statistical analysis conducted on geographies consisting of 196,065,310 people shows a slight positive correlation between the proportion of Immigrants from Greece and poverty level among single males in the United States with a correlation coefficient (R) of 0.079 and weighted average of 11.9%, a difference of 27.1%.
Single Male Poverty Correlation Summary
| Measurement | Cree | Immigrants from Greece |
| Minimum | 11.0% | 2.4% |
| Maximum | 100.0% | 62.5% |
| Range | 89.0% | 60.1% |
| Mean | 34.6% | 15.7% |
| Median | 28.6% | 11.7% |
| Interquartile 25% (IQ1) | 15.2% | 9.1% |
| Interquartile 75% (IQ3) | 45.0% | 14.0% |
| Interquartile Range (IQR) | 29.8% | 4.9% |
| Standard Deviation (Sample) | 23.1% | 12.9% |
| Standard Deviation (Population) | 22.6% | 12.8% |
Similar Demographics by Single Male Poverty
Demographics Similar to Cree by Single Male Poverty
In terms of single male poverty, the demographic groups most similar to Cree are Delaware (15.0%, a difference of 0.45%), Dominican (15.2%, a difference of 0.82%), French American Indian (15.0%, a difference of 0.84%), Alsatian (15.2%, a difference of 0.98%), and Aleut (15.4%, a difference of 2.0%).
| Demographics | Rating | Rank | Single Male Poverty |
| French Canadians | 0.0 /100 | #293 | Tragic 14.6% |
| Ottawa | 0.0 /100 | #294 | Tragic 14.6% |
| Scotch-Irish | 0.0 /100 | #295 | Tragic 14.7% |
| Africans | 0.0 /100 | #296 | Tragic 14.7% |
| Immigrants | Dominican Republic | 0.0 /100 | #297 | Tragic 14.8% |
| French American Indians | 0.0 /100 | #298 | Tragic 15.0% |
| Delaware | 0.0 /100 | #299 | Tragic 15.0% |
| Cree | 0.0 /100 | #300 | Tragic 15.1% |
| Dominicans | 0.0 /100 | #301 | Tragic 15.2% |
| Alsatians | 0.0 /100 | #302 | Tragic 15.2% |
| Aleuts | 0.0 /100 | #303 | Tragic 15.4% |
| Alaska Natives | 0.0 /100 | #304 | Tragic 15.4% |
| Blackfeet | 0.0 /100 | #305 | Tragic 15.5% |
| Pennsylvania Germans | 0.0 /100 | #306 | Tragic 15.6% |
| Ute | 0.0 /100 | #307 | Tragic 15.7% |
Demographics Similar to Immigrants from Greece by Single Male Poverty
In terms of single male poverty, the demographic groups most similar to Immigrants from Greece are Immigrants from Nepal (11.9%, a difference of 0.060%), Immigrants from Russia (11.9%, a difference of 0.080%), Immigrants from Croatia (11.9%, a difference of 0.10%), Immigrants from Ukraine (11.9%, a difference of 0.12%), and Immigrants from Uruguay (11.9%, a difference of 0.13%).
| Demographics | Rating | Rank | Single Male Poverty |
| Immigrants | Eastern Europe | 99.6 /100 | #64 | Exceptional 11.8% |
| Laotians | 99.6 /100 | #65 | Exceptional 11.9% |
| Immigrants | Uruguay | 99.6 /100 | #66 | Exceptional 11.9% |
| Immigrants | Ukraine | 99.6 /100 | #67 | Exceptional 11.9% |
| Immigrants | Croatia | 99.6 /100 | #68 | Exceptional 11.9% |
| Immigrants | Russia | 99.6 /100 | #69 | Exceptional 11.9% |
| Immigrants | Nepal | 99.6 /100 | #70 | Exceptional 11.9% |
| Immigrants | Greece | 99.6 /100 | #71 | Exceptional 11.9% |
| Immigrants | Argentina | 99.5 /100 | #72 | Exceptional 11.9% |
| Argentineans | 99.5 /100 | #73 | Exceptional 11.9% |
| Chileans | 99.5 /100 | #74 | Exceptional 11.9% |
| Uruguayans | 99.4 /100 | #75 | Exceptional 11.9% |
| Immigrants | Northern Africa | 99.4 /100 | #76 | Exceptional 11.9% |
| Immigrants | Malaysia | 99.2 /100 | #77 | Exceptional 12.0% |
| Immigrants | Venezuela | 99.1 /100 | #78 | Exceptional 12.0% |