Romanian vs Osage Single Male Poverty
COMPARE
Romanian
Osage
Single Male Poverty
Single Male Poverty Comparison
Romanians
Osage
12.5%
SINGLE MALE POVERTY
86.4/ 100
METRIC RATING
126th/ 347
METRIC RANK
16.5%
SINGLE MALE POVERTY
0.0/ 100
METRIC RATING
321st/ 347
METRIC RANK
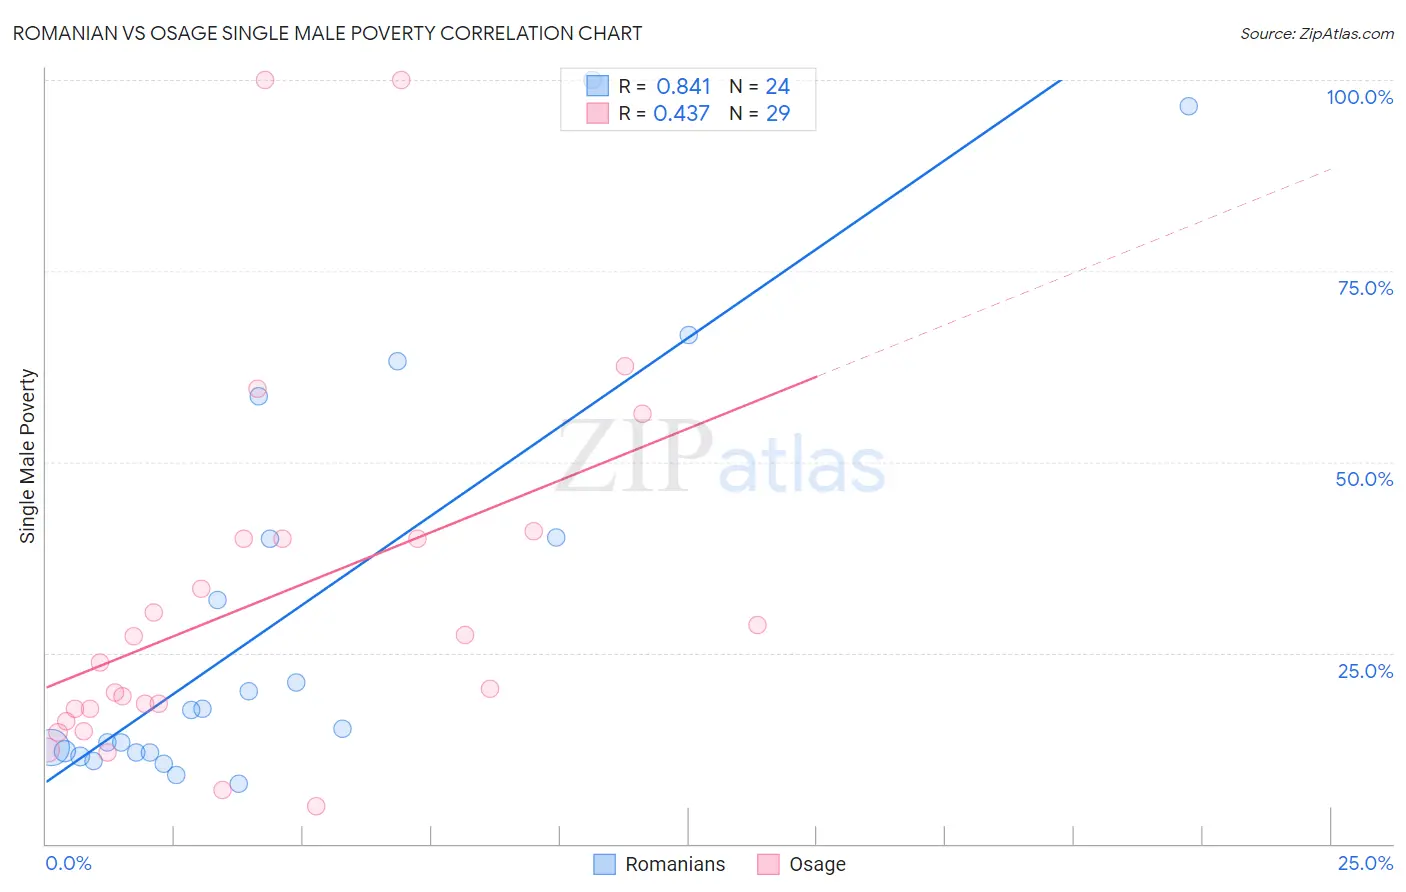
Romanian vs Osage Single Male Poverty Correlation Chart
The statistical analysis conducted on geographies consisting of 331,496,845 people shows a very strong positive correlation between the proportion of Romanians and poverty level among single males in the United States with a correlation coefficient (R) of 0.841 and weighted average of 12.5%. Similarly, the statistical analysis conducted on geographies consisting of 87,587,587 people shows a moderate positive correlation between the proportion of Osage and poverty level among single males in the United States with a correlation coefficient (R) of 0.437 and weighted average of 16.5%, a difference of 31.9%.
Single Male Poverty Correlation Summary
| Measurement | Romanian | Osage |
| Minimum | 7.9% | 5.0% |
| Maximum | 100.0% | 100.0% |
| Range | 92.1% | 95.0% |
| Mean | 29.7% | 31.8% |
| Median | 16.2% | 23.8% |
| Interquartile 25% (IQ1) | 12.0% | 16.9% |
| Interquartile 75% (IQ3) | 40.1% | 40.0% |
| Interquartile Range (IQR) | 28.1% | 23.1% |
| Standard Deviation (Sample) | 27.5% | 24.0% |
| Standard Deviation (Population) | 26.9% | 23.6% |
Similar Demographics by Single Male Poverty
Demographics Similar to Romanians by Single Male Poverty
In terms of single male poverty, the demographic groups most similar to Romanians are Immigrants from Netherlands (12.5%, a difference of 0.010%), Ecuadorian (12.5%, a difference of 0.050%), Immigrants from Jordan (12.5%, a difference of 0.080%), Immigrants from Sierra Leone (12.5%, a difference of 0.090%), and Russian (12.5%, a difference of 0.11%).
| Demographics | Rating | Rank | Single Male Poverty |
| Immigrants | Albania | 90.3 /100 | #119 | Exceptional 12.4% |
| Venezuelans | 89.4 /100 | #120 | Excellent 12.4% |
| Icelanders | 88.2 /100 | #121 | Excellent 12.5% |
| Serbians | 87.9 /100 | #122 | Excellent 12.5% |
| Immigrants | Kenya | 87.6 /100 | #123 | Excellent 12.5% |
| Russians | 87.3 /100 | #124 | Excellent 12.5% |
| Immigrants | Jordan | 87.1 /100 | #125 | Excellent 12.5% |
| Romanians | 86.4 /100 | #126 | Excellent 12.5% |
| Immigrants | Netherlands | 86.2 /100 | #127 | Excellent 12.5% |
| Ecuadorians | 85.9 /100 | #128 | Excellent 12.5% |
| Immigrants | Sierra Leone | 85.5 /100 | #129 | Excellent 12.5% |
| Immigrants | Nicaragua | 84.8 /100 | #130 | Excellent 12.5% |
| Immigrants | Northern Europe | 83.7 /100 | #131 | Excellent 12.5% |
| Salvadorans | 83.7 /100 | #132 | Excellent 12.5% |
| Immigrants | Western Asia | 83.4 /100 | #133 | Excellent 12.5% |
Demographics Similar to Osage by Single Male Poverty
In terms of single male poverty, the demographic groups most similar to Osage are Marshallese (16.4%, a difference of 0.13%), Chippewa (16.4%, a difference of 0.61%), Chickasaw (16.3%, a difference of 0.91%), Shoshone (16.7%, a difference of 1.3%), and Black/African American (16.2%, a difference of 1.7%).
| Demographics | Rating | Rank | Single Male Poverty |
| Alaskan Athabascans | 0.0 /100 | #314 | Tragic 16.1% |
| Cheyenne | 0.0 /100 | #315 | Tragic 16.1% |
| Dutch West Indians | 0.0 /100 | #316 | Tragic 16.1% |
| Blacks/African Americans | 0.0 /100 | #317 | Tragic 16.2% |
| Chickasaw | 0.0 /100 | #318 | Tragic 16.3% |
| Chippewa | 0.0 /100 | #319 | Tragic 16.4% |
| Marshallese | 0.0 /100 | #320 | Tragic 16.4% |
| Osage | 0.0 /100 | #321 | Tragic 16.5% |
| Shoshone | 0.0 /100 | #322 | Tragic 16.7% |
| Creek | 0.0 /100 | #323 | Tragic 16.8% |
| Immigrants | Yemen | 0.0 /100 | #324 | Tragic 16.9% |
| Choctaw | 0.0 /100 | #325 | Tragic 17.0% |
| Central American Indians | 0.0 /100 | #326 | Tragic 17.2% |
| Menominee | 0.0 /100 | #327 | Tragic 17.7% |
| Kiowa | 0.0 /100 | #328 | Tragic 18.3% |