Cree vs Estonian Single Male Poverty
COMPARE
Cree
Estonian
Single Male Poverty
Single Male Poverty Comparison
Cree
Estonians
15.1%
SINGLE MALE POVERTY
0.0/ 100
METRIC RATING
300th/ 347
METRIC RANK
13.0%
SINGLE MALE POVERTY
20.3/ 100
METRIC RATING
204th/ 347
METRIC RANK
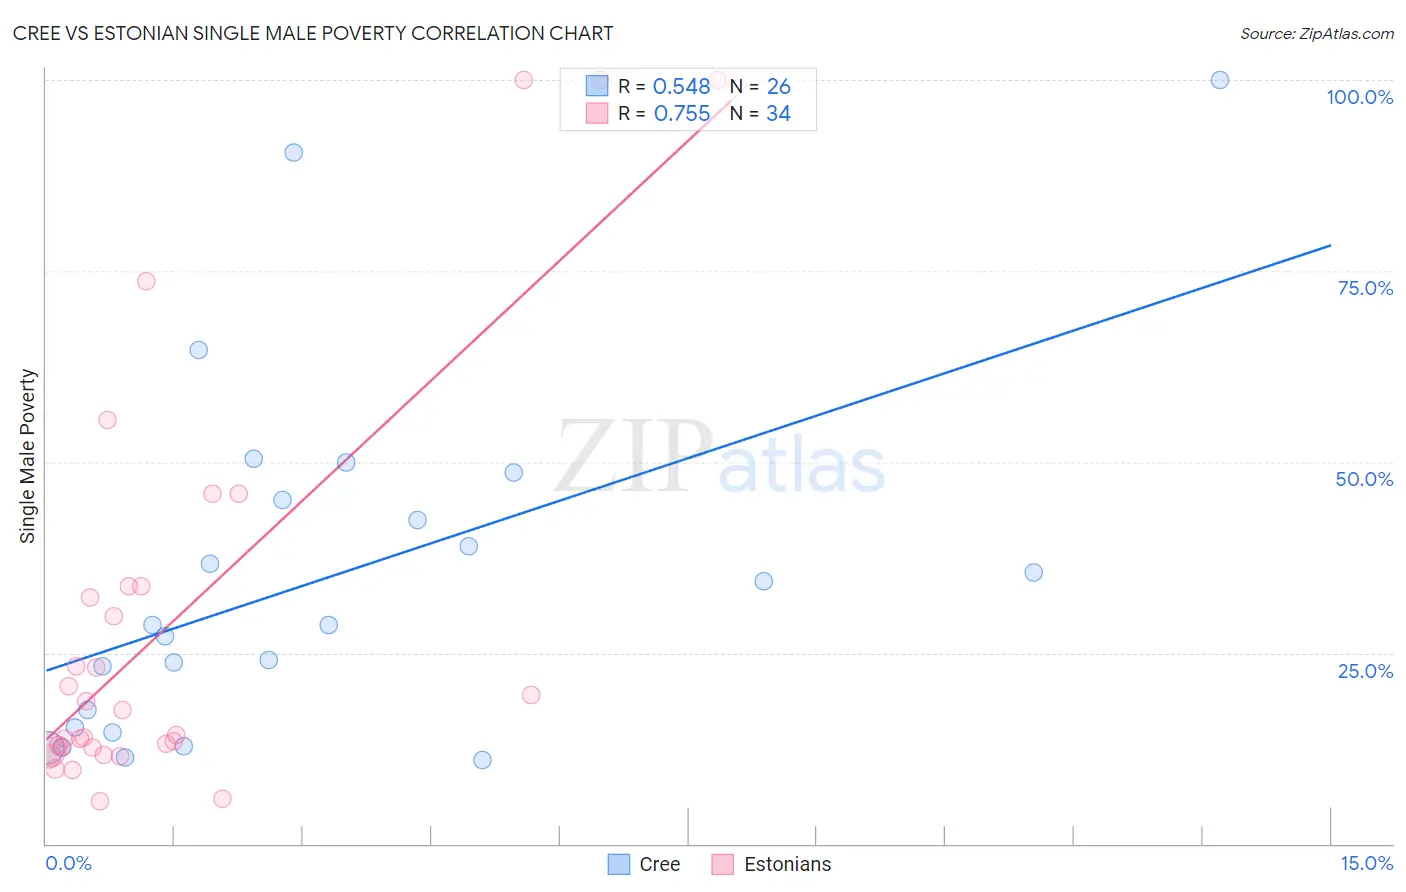
Cree vs Estonian Single Male Poverty Correlation Chart
The statistical analysis conducted on geographies consisting of 73,575,391 people shows a substantial positive correlation between the proportion of Cree and poverty level among single males in the United States with a correlation coefficient (R) of 0.548 and weighted average of 15.1%. Similarly, the statistical analysis conducted on geographies consisting of 115,524,258 people shows a strong positive correlation between the proportion of Estonians and poverty level among single males in the United States with a correlation coefficient (R) of 0.755 and weighted average of 13.0%, a difference of 15.9%.
Single Male Poverty Correlation Summary
| Measurement | Cree | Estonian |
| Minimum | 11.0% | 5.6% |
| Maximum | 100.0% | 100.0% |
| Range | 89.0% | 94.4% |
| Mean | 34.6% | 28.6% |
| Median | 28.6% | 15.9% |
| Interquartile 25% (IQ1) | 15.2% | 12.6% |
| Interquartile 75% (IQ3) | 45.0% | 33.7% |
| Interquartile Range (IQR) | 29.8% | 21.1% |
| Standard Deviation (Sample) | 23.1% | 27.0% |
| Standard Deviation (Population) | 22.6% | 26.6% |
Similar Demographics by Single Male Poverty
Demographics Similar to Cree by Single Male Poverty
In terms of single male poverty, the demographic groups most similar to Cree are Delaware (15.0%, a difference of 0.45%), Dominican (15.2%, a difference of 0.82%), French American Indian (15.0%, a difference of 0.84%), Alsatian (15.2%, a difference of 0.98%), and Aleut (15.4%, a difference of 2.0%).
| Demographics | Rating | Rank | Single Male Poverty |
| French Canadians | 0.0 /100 | #293 | Tragic 14.6% |
| Ottawa | 0.0 /100 | #294 | Tragic 14.6% |
| Scotch-Irish | 0.0 /100 | #295 | Tragic 14.7% |
| Africans | 0.0 /100 | #296 | Tragic 14.7% |
| Immigrants | Dominican Republic | 0.0 /100 | #297 | Tragic 14.8% |
| French American Indians | 0.0 /100 | #298 | Tragic 15.0% |
| Delaware | 0.0 /100 | #299 | Tragic 15.0% |
| Cree | 0.0 /100 | #300 | Tragic 15.1% |
| Dominicans | 0.0 /100 | #301 | Tragic 15.2% |
| Alsatians | 0.0 /100 | #302 | Tragic 15.2% |
| Aleuts | 0.0 /100 | #303 | Tragic 15.4% |
| Alaska Natives | 0.0 /100 | #304 | Tragic 15.4% |
| Blackfeet | 0.0 /100 | #305 | Tragic 15.5% |
| Pennsylvania Germans | 0.0 /100 | #306 | Tragic 15.6% |
| Ute | 0.0 /100 | #307 | Tragic 15.7% |
Demographics Similar to Estonians by Single Male Poverty
In terms of single male poverty, the demographic groups most similar to Estonians are Immigrants from Bangladesh (13.0%, a difference of 0.0%), Basque (13.0%, a difference of 0.030%), Polish (13.0%, a difference of 0.080%), Trinidadian and Tobagonian (13.0%, a difference of 0.090%), and Slovene (13.0%, a difference of 0.10%).
| Demographics | Rating | Rank | Single Male Poverty |
| Immigrants | Laos | 23.1 /100 | #197 | Fair 13.0% |
| Lithuanians | 22.1 /100 | #198 | Fair 13.0% |
| Immigrants | Norway | 21.8 /100 | #199 | Fair 13.0% |
| Slovenes | 21.6 /100 | #200 | Fair 13.0% |
| Trinidadians and Tobagonians | 21.4 /100 | #201 | Fair 13.0% |
| Basques | 20.7 /100 | #202 | Fair 13.0% |
| Immigrants | Bangladesh | 20.4 /100 | #203 | Fair 13.0% |
| Estonians | 20.3 /100 | #204 | Fair 13.0% |
| Poles | 19.3 /100 | #205 | Poor 13.0% |
| Northern Europeans | 18.9 /100 | #206 | Poor 13.0% |
| Sudanese | 17.7 /100 | #207 | Poor 13.1% |
| Immigrants | Western Africa | 17.6 /100 | #208 | Poor 13.1% |
| Mexican American Indians | 17.5 /100 | #209 | Poor 13.1% |
| Immigrants | Haiti | 16.8 /100 | #210 | Poor 13.1% |
| Swedes | 16.8 /100 | #211 | Poor 13.1% |