Cree vs Immigrants from Belarus Male Poverty
COMPARE
Cree
Immigrants from Belarus
Male Poverty
Male Poverty Comparison
Cree
Immigrants from Belarus
13.3%
MALE POVERTY
0.0/ 100
METRIC RATING
270th/ 347
METRIC RANK
10.7%
MALE POVERTY
83.3/ 100
METRIC RATING
131st/ 347
METRIC RANK
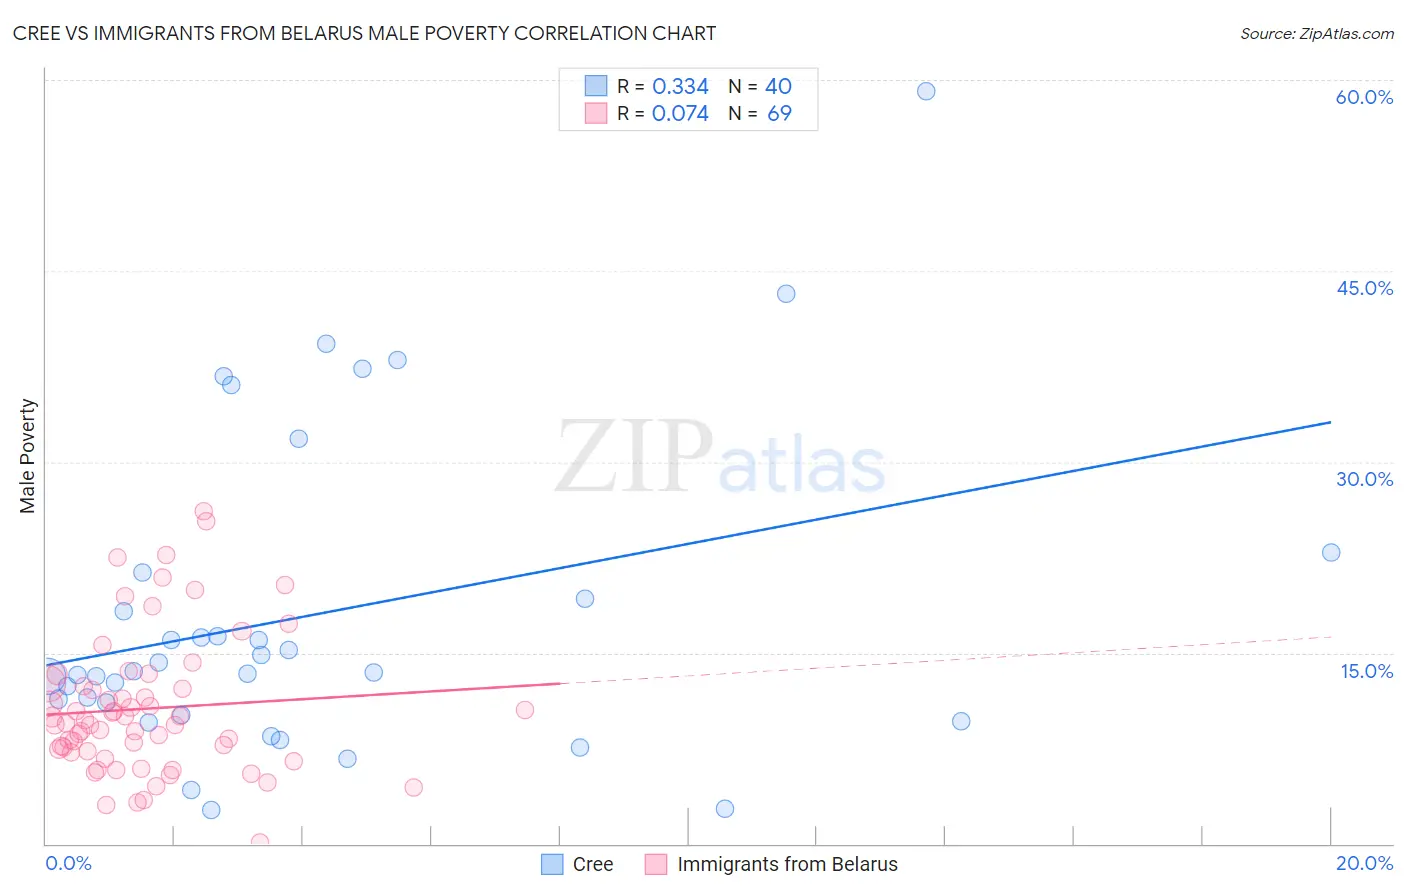
Cree vs Immigrants from Belarus Male Poverty Correlation Chart
The statistical analysis conducted on geographies consisting of 76,204,291 people shows a mild positive correlation between the proportion of Cree and poverty level among males in the United States with a correlation coefficient (R) of 0.334 and weighted average of 13.3%. Similarly, the statistical analysis conducted on geographies consisting of 150,164,106 people shows a slight positive correlation between the proportion of Immigrants from Belarus and poverty level among males in the United States with a correlation coefficient (R) of 0.074 and weighted average of 10.7%, a difference of 24.2%.
Male Poverty Correlation Summary
| Measurement | Cree | Immigrants from Belarus |
| Minimum | 2.7% | 0.12% |
| Maximum | 59.1% | 26.1% |
| Range | 56.4% | 25.9% |
| Mean | 18.0% | 10.6% |
| Median | 13.5% | 9.5% |
| Interquartile 25% (IQ1) | 10.6% | 7.2% |
| Interquartile 75% (IQ3) | 20.2% | 12.5% |
| Interquartile Range (IQR) | 9.6% | 5.3% |
| Standard Deviation (Sample) | 12.5% | 5.5% |
| Standard Deviation (Population) | 12.4% | 5.4% |
Similar Demographics by Male Poverty
Demographics Similar to Cree by Male Poverty
In terms of male poverty, the demographic groups most similar to Cree are Spanish American (13.4%, a difference of 0.030%), Guyanese (13.3%, a difference of 0.47%), Subsaharan African (13.3%, a difference of 0.69%), Immigrants from Jamaica (13.3%, a difference of 0.72%), and Immigrants from Bahamas (13.5%, a difference of 0.78%).
| Demographics | Rating | Rank | Male Poverty |
| Central Americans | 0.1 /100 | #263 | Tragic 13.2% |
| Iroquois | 0.1 /100 | #264 | Tragic 13.2% |
| Jamaicans | 0.1 /100 | #265 | Tragic 13.2% |
| Immigrants | Guyana | 0.1 /100 | #266 | Tragic 13.2% |
| Immigrants | Jamaica | 0.1 /100 | #267 | Tragic 13.3% |
| Sub-Saharan Africans | 0.1 /100 | #268 | Tragic 13.3% |
| Guyanese | 0.0 /100 | #269 | Tragic 13.3% |
| Cree | 0.0 /100 | #270 | Tragic 13.3% |
| Spanish Americans | 0.0 /100 | #271 | Tragic 13.4% |
| Immigrants | Bahamas | 0.0 /100 | #272 | Tragic 13.5% |
| Chickasaw | 0.0 /100 | #273 | Tragic 13.5% |
| Immigrants | West Indies | 0.0 /100 | #274 | Tragic 13.5% |
| Barbadians | 0.0 /100 | #275 | Tragic 13.6% |
| Immigrants | Latin America | 0.0 /100 | #276 | Tragic 13.6% |
| Bangladeshis | 0.0 /100 | #277 | Tragic 13.6% |
Demographics Similar to Immigrants from Belarus by Male Poverty
In terms of male poverty, the demographic groups most similar to Immigrants from Belarus are Immigrants from Vietnam (10.8%, a difference of 0.050%), Pakistani (10.8%, a difference of 0.060%), New Zealander (10.8%, a difference of 0.070%), Chilean (10.7%, a difference of 0.11%), and Brazilian (10.8%, a difference of 0.11%).
| Demographics | Rating | Rank | Male Poverty |
| French | 86.7 /100 | #124 | Excellent 10.7% |
| Immigrants | Norway | 86.0 /100 | #125 | Excellent 10.7% |
| Immigrants | Ukraine | 84.3 /100 | #126 | Excellent 10.7% |
| Puget Sound Salish | 84.3 /100 | #127 | Excellent 10.7% |
| Immigrants | Western Europe | 84.2 /100 | #128 | Excellent 10.7% |
| Immigrants | Peru | 84.1 /100 | #129 | Excellent 10.7% |
| Chileans | 83.9 /100 | #130 | Excellent 10.7% |
| Immigrants | Belarus | 83.3 /100 | #131 | Excellent 10.7% |
| Immigrants | Vietnam | 83.0 /100 | #132 | Excellent 10.8% |
| Pakistanis | 83.0 /100 | #133 | Excellent 10.8% |
| New Zealanders | 82.9 /100 | #134 | Excellent 10.8% |
| Brazilians | 82.7 /100 | #135 | Excellent 10.8% |
| Immigrants | Israel | 80.9 /100 | #136 | Excellent 10.8% |
| Immigrants | Switzerland | 79.2 /100 | #137 | Good 10.8% |
| Yugoslavians | 78.2 /100 | #138 | Good 10.8% |