Greek vs Immigrants from Latvia Male Poverty
COMPARE
Greek
Immigrants from Latvia
Male Poverty
Male Poverty Comparison
Greeks
Immigrants from Latvia
9.7%
MALE POVERTY
99.6/ 100
METRIC RATING
29th/ 347
METRIC RANK
10.5%
MALE POVERTY
92.8/ 100
METRIC RATING
100th/ 347
METRIC RANK
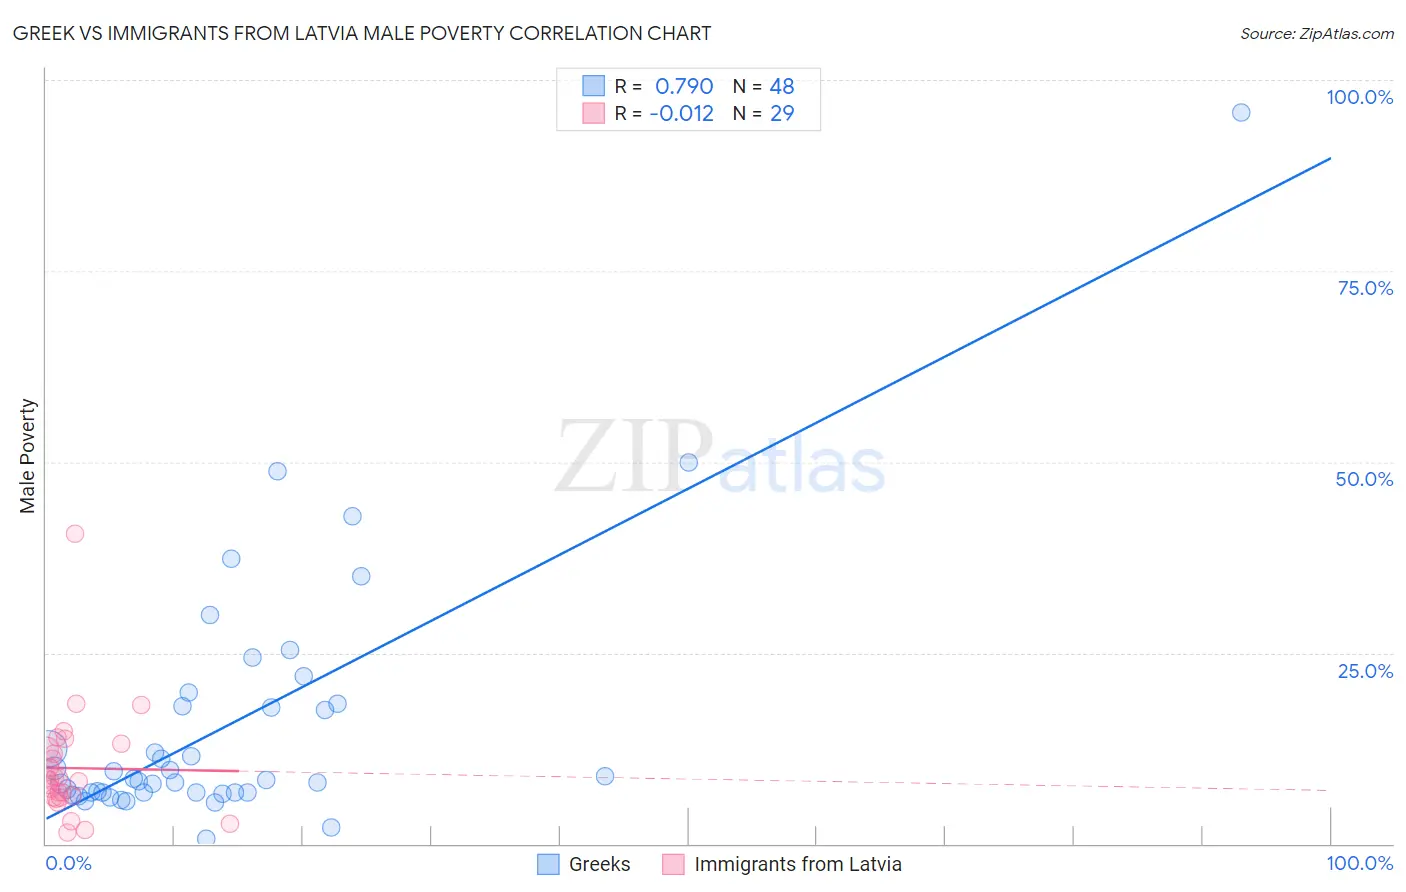
Greek vs Immigrants from Latvia Male Poverty Correlation Chart
The statistical analysis conducted on geographies consisting of 481,993,852 people shows a strong positive correlation between the proportion of Greeks and poverty level among males in the United States with a correlation coefficient (R) of 0.790 and weighted average of 9.7%. Similarly, the statistical analysis conducted on geographies consisting of 113,727,577 people shows no correlation between the proportion of Immigrants from Latvia and poverty level among males in the United States with a correlation coefficient (R) of -0.012 and weighted average of 10.5%, a difference of 8.1%.
Male Poverty Correlation Summary
| Measurement | Greek | Immigrants from Latvia |
| Minimum | 0.65% | 1.5% |
| Maximum | 95.7% | 40.7% |
| Range | 95.1% | 39.2% |
| Mean | 15.6% | 9.9% |
| Median | 8.4% | 8.3% |
| Interquartile 25% (IQ1) | 6.7% | 6.1% |
| Interquartile 75% (IQ3) | 18.1% | 12.8% |
| Interquartile Range (IQR) | 11.4% | 6.7% |
| Standard Deviation (Sample) | 16.7% | 7.4% |
| Standard Deviation (Population) | 16.5% | 7.2% |
Similar Demographics by Male Poverty
Demographics Similar to Greeks by Male Poverty
In terms of male poverty, the demographic groups most similar to Greeks are Immigrants from Korea (9.7%, a difference of 0.040%), Polish (9.7%, a difference of 0.080%), Tongan (9.7%, a difference of 0.10%), Danish (9.7%, a difference of 0.12%), and Burmese (9.7%, a difference of 0.25%).
| Demographics | Rating | Rank | Male Poverty |
| Croatians | 99.7 /100 | #22 | Exceptional 9.6% |
| Italians | 99.7 /100 | #23 | Exceptional 9.6% |
| Swedes | 99.7 /100 | #24 | Exceptional 9.6% |
| Eastern Europeans | 99.6 /100 | #25 | Exceptional 9.6% |
| Burmese | 99.6 /100 | #26 | Exceptional 9.7% |
| Danes | 99.6 /100 | #27 | Exceptional 9.7% |
| Immigrants | Korea | 99.6 /100 | #28 | Exceptional 9.7% |
| Greeks | 99.6 /100 | #29 | Exceptional 9.7% |
| Poles | 99.5 /100 | #30 | Exceptional 9.7% |
| Tongans | 99.5 /100 | #31 | Exceptional 9.7% |
| Macedonians | 99.5 /100 | #32 | Exceptional 9.7% |
| Immigrants | Northern Europe | 99.5 /100 | #33 | Exceptional 9.7% |
| Immigrants | Poland | 99.5 /100 | #34 | Exceptional 9.8% |
| Iranians | 99.4 /100 | #35 | Exceptional 9.8% |
| Czechs | 99.4 /100 | #36 | Exceptional 9.8% |
Demographics Similar to Immigrants from Latvia by Male Poverty
In terms of male poverty, the demographic groups most similar to Immigrants from Latvia are Immigrants from Indonesia (10.5%, a difference of 0.21%), Finnish (10.5%, a difference of 0.28%), Immigrants from Zimbabwe (10.5%, a difference of 0.29%), French Canadian (10.5%, a difference of 0.30%), and Romanian (10.5%, a difference of 0.34%).
| Demographics | Rating | Rank | Male Poverty |
| Australians | 94.4 /100 | #93 | Exceptional 10.4% |
| Immigrants | South Africa | 94.1 /100 | #94 | Exceptional 10.4% |
| Scottish | 94.0 /100 | #95 | Exceptional 10.4% |
| Immigrants | Egypt | 93.7 /100 | #96 | Exceptional 10.4% |
| Romanians | 93.6 /100 | #97 | Exceptional 10.5% |
| Finns | 93.4 /100 | #98 | Exceptional 10.5% |
| Immigrants | Indonesia | 93.3 /100 | #99 | Exceptional 10.5% |
| Immigrants | Latvia | 92.8 /100 | #100 | Exceptional 10.5% |
| Immigrants | Zimbabwe | 92.0 /100 | #101 | Exceptional 10.5% |
| French Canadians | 91.9 /100 | #102 | Exceptional 10.5% |
| Slavs | 91.7 /100 | #103 | Exceptional 10.5% |
| Welsh | 91.6 /100 | #104 | Exceptional 10.5% |
| Canadians | 91.6 /100 | #105 | Exceptional 10.5% |
| Immigrants | Southern Europe | 91.3 /100 | #106 | Exceptional 10.5% |
| Laotians | 91.2 /100 | #107 | Exceptional 10.5% |