Mongolian vs Immigrants from Latvia Male Poverty
COMPARE
Mongolian
Immigrants from Latvia
Male Poverty
Male Poverty Comparison
Mongolians
Immigrants from Latvia
11.3%
MALE POVERTY
39.0/ 100
METRIC RATING
182nd/ 347
METRIC RANK
10.5%
MALE POVERTY
92.8/ 100
METRIC RATING
100th/ 347
METRIC RANK
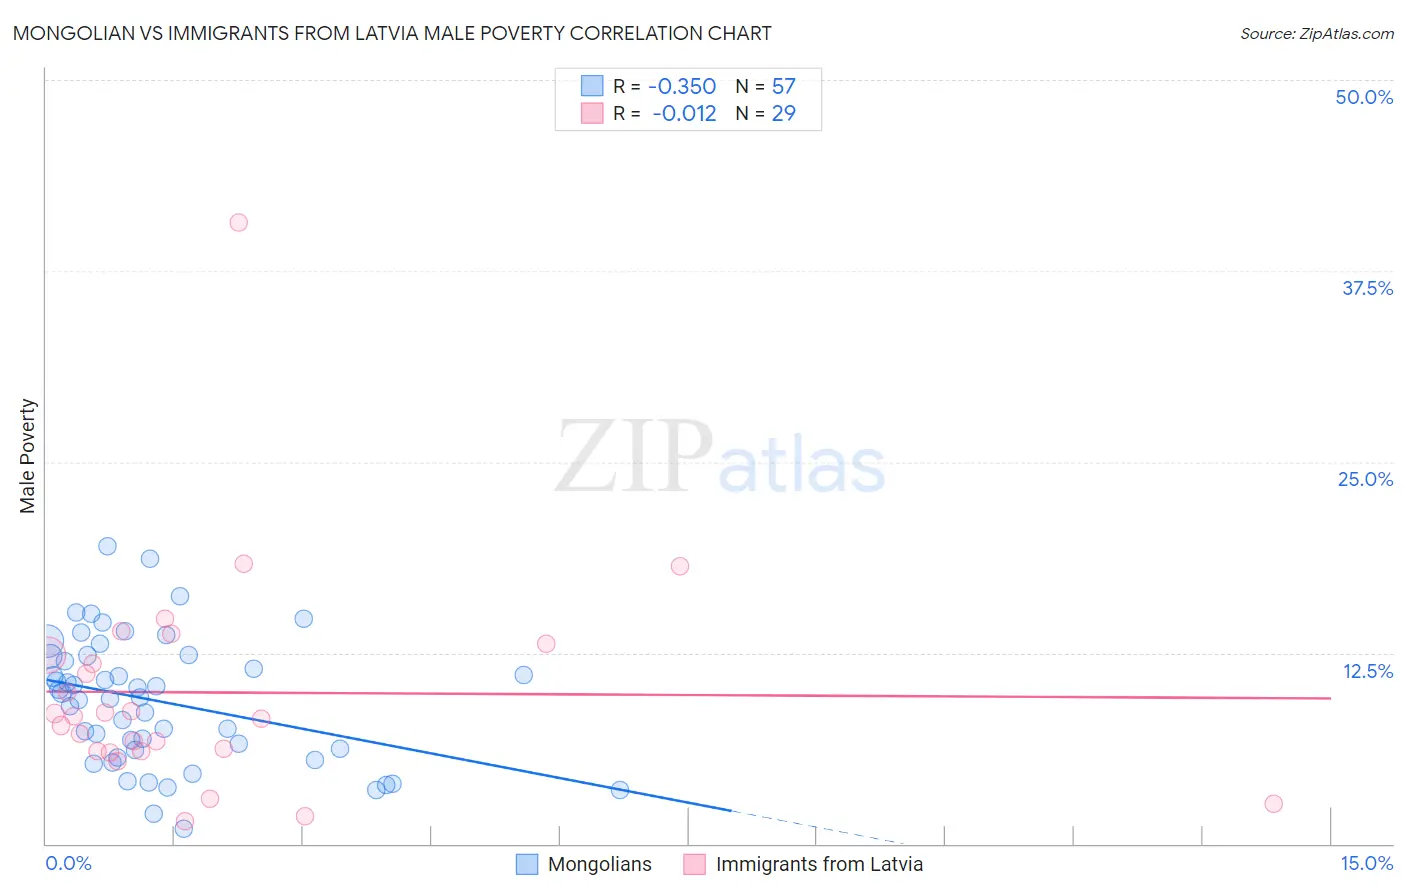
Mongolian vs Immigrants from Latvia Male Poverty Correlation Chart
The statistical analysis conducted on geographies consisting of 140,285,777 people shows a mild negative correlation between the proportion of Mongolians and poverty level among males in the United States with a correlation coefficient (R) of -0.350 and weighted average of 11.3%. Similarly, the statistical analysis conducted on geographies consisting of 113,727,577 people shows no correlation between the proportion of Immigrants from Latvia and poverty level among males in the United States with a correlation coefficient (R) of -0.012 and weighted average of 10.5%, a difference of 7.8%.
Male Poverty Correlation Summary
| Measurement | Mongolian | Immigrants from Latvia |
| Minimum | 0.97% | 1.5% |
| Maximum | 19.4% | 40.7% |
| Range | 18.5% | 39.2% |
| Mean | 9.3% | 9.9% |
| Median | 9.6% | 8.3% |
| Interquartile 25% (IQ1) | 5.9% | 6.1% |
| Interquartile 75% (IQ3) | 12.3% | 12.8% |
| Interquartile Range (IQR) | 6.4% | 6.7% |
| Standard Deviation (Sample) | 4.2% | 7.4% |
| Standard Deviation (Population) | 4.2% | 7.2% |
Similar Demographics by Male Poverty
Demographics Similar to Mongolians by Male Poverty
In terms of male poverty, the demographic groups most similar to Mongolians are Immigrants from Costa Rica (11.3%, a difference of 0.050%), Kenyan (11.3%, a difference of 0.060%), Immigrants from Morocco (11.3%, a difference of 0.11%), Immigrants from Syria (11.3%, a difference of 0.13%), and Immigrants from South America (11.3%, a difference of 0.22%).
| Demographics | Rating | Rank | Male Poverty |
| Celtics | 47.5 /100 | #175 | Average 11.2% |
| Immigrants | Fiji | 46.0 /100 | #176 | Average 11.2% |
| Lebanese | 45.6 /100 | #177 | Average 11.2% |
| Immigrants | Cameroon | 44.5 /100 | #178 | Average 11.2% |
| Immigrants | Syria | 40.3 /100 | #179 | Average 11.3% |
| Immigrants | Morocco | 40.1 /100 | #180 | Average 11.3% |
| Immigrants | Costa Rica | 39.5 /100 | #181 | Fair 11.3% |
| Mongolians | 39.0 /100 | #182 | Fair 11.3% |
| Kenyans | 38.4 /100 | #183 | Fair 11.3% |
| Immigrants | South America | 36.9 /100 | #184 | Fair 11.3% |
| Immigrants | Afghanistan | 33.3 /100 | #185 | Fair 11.4% |
| Immigrants | Sierra Leone | 32.9 /100 | #186 | Fair 11.4% |
| Immigrants | Iraq | 31.9 /100 | #187 | Fair 11.4% |
| Sierra Leoneans | 29.9 /100 | #188 | Fair 11.4% |
| Hawaiians | 28.3 /100 | #189 | Fair 11.4% |
Demographics Similar to Immigrants from Latvia by Male Poverty
In terms of male poverty, the demographic groups most similar to Immigrants from Latvia are Immigrants from Indonesia (10.5%, a difference of 0.21%), Finnish (10.5%, a difference of 0.28%), Immigrants from Zimbabwe (10.5%, a difference of 0.29%), French Canadian (10.5%, a difference of 0.30%), and Romanian (10.5%, a difference of 0.34%).
| Demographics | Rating | Rank | Male Poverty |
| Australians | 94.4 /100 | #93 | Exceptional 10.4% |
| Immigrants | South Africa | 94.1 /100 | #94 | Exceptional 10.4% |
| Scottish | 94.0 /100 | #95 | Exceptional 10.4% |
| Immigrants | Egypt | 93.7 /100 | #96 | Exceptional 10.4% |
| Romanians | 93.6 /100 | #97 | Exceptional 10.5% |
| Finns | 93.4 /100 | #98 | Exceptional 10.5% |
| Immigrants | Indonesia | 93.3 /100 | #99 | Exceptional 10.5% |
| Immigrants | Latvia | 92.8 /100 | #100 | Exceptional 10.5% |
| Immigrants | Zimbabwe | 92.0 /100 | #101 | Exceptional 10.5% |
| French Canadians | 91.9 /100 | #102 | Exceptional 10.5% |
| Slavs | 91.7 /100 | #103 | Exceptional 10.5% |
| Welsh | 91.6 /100 | #104 | Exceptional 10.5% |
| Canadians | 91.6 /100 | #105 | Exceptional 10.5% |
| Immigrants | Southern Europe | 91.3 /100 | #106 | Exceptional 10.5% |
| Laotians | 91.2 /100 | #107 | Exceptional 10.5% |