Cree vs Immigrants from Oceania Male Poverty
COMPARE
Cree
Immigrants from Oceania
Male Poverty
Male Poverty Comparison
Cree
Immigrants from Oceania
13.3%
MALE POVERTY
0.0/ 100
METRIC RATING
270th/ 347
METRIC RANK
11.2%
MALE POVERTY
50.0/ 100
METRIC RATING
174th/ 347
METRIC RANK
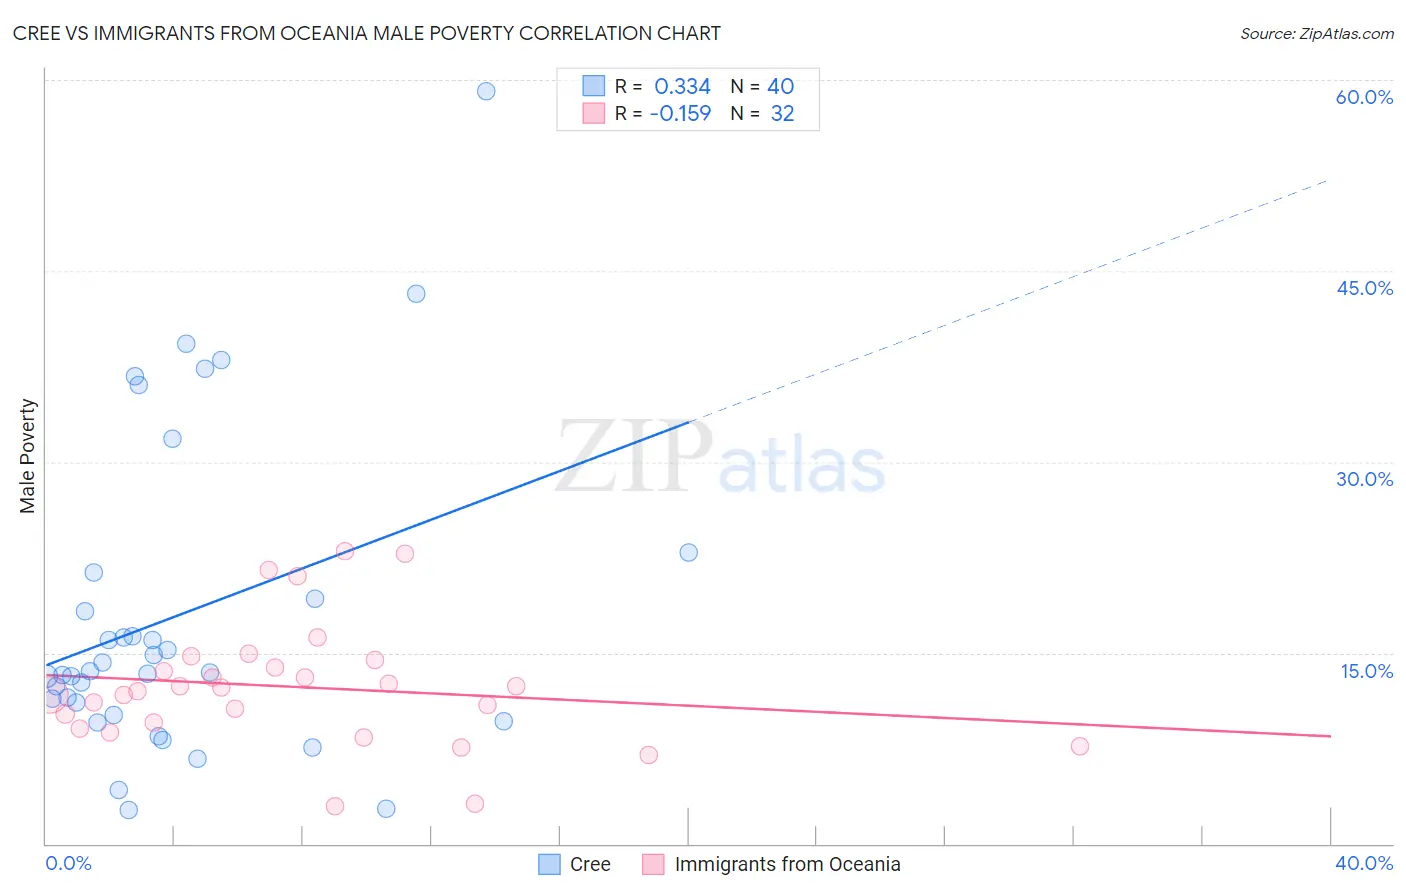
Cree vs Immigrants from Oceania Male Poverty Correlation Chart
The statistical analysis conducted on geographies consisting of 76,204,291 people shows a mild positive correlation between the proportion of Cree and poverty level among males in the United States with a correlation coefficient (R) of 0.334 and weighted average of 13.3%. Similarly, the statistical analysis conducted on geographies consisting of 305,340,172 people shows a poor negative correlation between the proportion of Immigrants from Oceania and poverty level among males in the United States with a correlation coefficient (R) of -0.159 and weighted average of 11.2%, a difference of 19.3%.
Male Poverty Correlation Summary
| Measurement | Cree | Immigrants from Oceania |
| Minimum | 2.7% | 3.0% |
| Maximum | 59.1% | 23.0% |
| Range | 56.4% | 20.0% |
| Mean | 18.0% | 12.3% |
| Median | 13.5% | 12.1% |
| Interquartile 25% (IQ1) | 10.6% | 9.3% |
| Interquartile 75% (IQ3) | 20.2% | 14.2% |
| Interquartile Range (IQR) | 9.6% | 4.9% |
| Standard Deviation (Sample) | 12.5% | 4.8% |
| Standard Deviation (Population) | 12.4% | 4.8% |
Similar Demographics by Male Poverty
Demographics Similar to Cree by Male Poverty
In terms of male poverty, the demographic groups most similar to Cree are Spanish American (13.4%, a difference of 0.030%), Guyanese (13.3%, a difference of 0.47%), Subsaharan African (13.3%, a difference of 0.69%), Immigrants from Jamaica (13.3%, a difference of 0.72%), and Immigrants from Bahamas (13.5%, a difference of 0.78%).
| Demographics | Rating | Rank | Male Poverty |
| Central Americans | 0.1 /100 | #263 | Tragic 13.2% |
| Iroquois | 0.1 /100 | #264 | Tragic 13.2% |
| Jamaicans | 0.1 /100 | #265 | Tragic 13.2% |
| Immigrants | Guyana | 0.1 /100 | #266 | Tragic 13.2% |
| Immigrants | Jamaica | 0.1 /100 | #267 | Tragic 13.3% |
| Sub-Saharan Africans | 0.1 /100 | #268 | Tragic 13.3% |
| Guyanese | 0.0 /100 | #269 | Tragic 13.3% |
| Cree | 0.0 /100 | #270 | Tragic 13.3% |
| Spanish Americans | 0.0 /100 | #271 | Tragic 13.4% |
| Immigrants | Bahamas | 0.0 /100 | #272 | Tragic 13.5% |
| Chickasaw | 0.0 /100 | #273 | Tragic 13.5% |
| Immigrants | West Indies | 0.0 /100 | #274 | Tragic 13.5% |
| Barbadians | 0.0 /100 | #275 | Tragic 13.6% |
| Immigrants | Latin America | 0.0 /100 | #276 | Tragic 13.6% |
| Bangladeshis | 0.0 /100 | #277 | Tragic 13.6% |
Demographics Similar to Immigrants from Oceania by Male Poverty
In terms of male poverty, the demographic groups most similar to Immigrants from Oceania are Pennsylvania German (11.2%, a difference of 0.040%), Immigrants from Ethiopia (11.2%, a difference of 0.070%), Uruguayan (11.2%, a difference of 0.10%), Celtic (11.2%, a difference of 0.25%), and South American (11.1%, a difference of 0.37%).
| Demographics | Rating | Rank | Male Poverty |
| Hungarians | 55.1 /100 | #167 | Average 11.1% |
| Immigrants | Portugal | 54.9 /100 | #168 | Average 11.1% |
| Immigrants | Colombia | 54.2 /100 | #169 | Average 11.1% |
| South Americans | 53.8 /100 | #170 | Average 11.1% |
| Uruguayans | 51.0 /100 | #171 | Average 11.2% |
| Immigrants | Ethiopia | 50.7 /100 | #172 | Average 11.2% |
| Pennsylvania Germans | 50.5 /100 | #173 | Average 11.2% |
| Immigrants | Oceania | 50.0 /100 | #174 | Average 11.2% |
| Celtics | 47.5 /100 | #175 | Average 11.2% |
| Immigrants | Fiji | 46.0 /100 | #176 | Average 11.2% |
| Lebanese | 45.6 /100 | #177 | Average 11.2% |
| Immigrants | Cameroon | 44.5 /100 | #178 | Average 11.2% |
| Immigrants | Syria | 40.3 /100 | #179 | Average 11.3% |
| Immigrants | Morocco | 40.1 /100 | #180 | Average 11.3% |
| Immigrants | Costa Rica | 39.5 /100 | #181 | Fair 11.3% |