Cree vs Immigrants from El Salvador Male Poverty
COMPARE
Cree
Immigrants from El Salvador
Male Poverty
Male Poverty Comparison
Cree
Immigrants from El Salvador
13.3%
MALE POVERTY
0.0/ 100
METRIC RATING
270th/ 347
METRIC RANK
12.8%
MALE POVERTY
0.2/ 100
METRIC RATING
246th/ 347
METRIC RANK
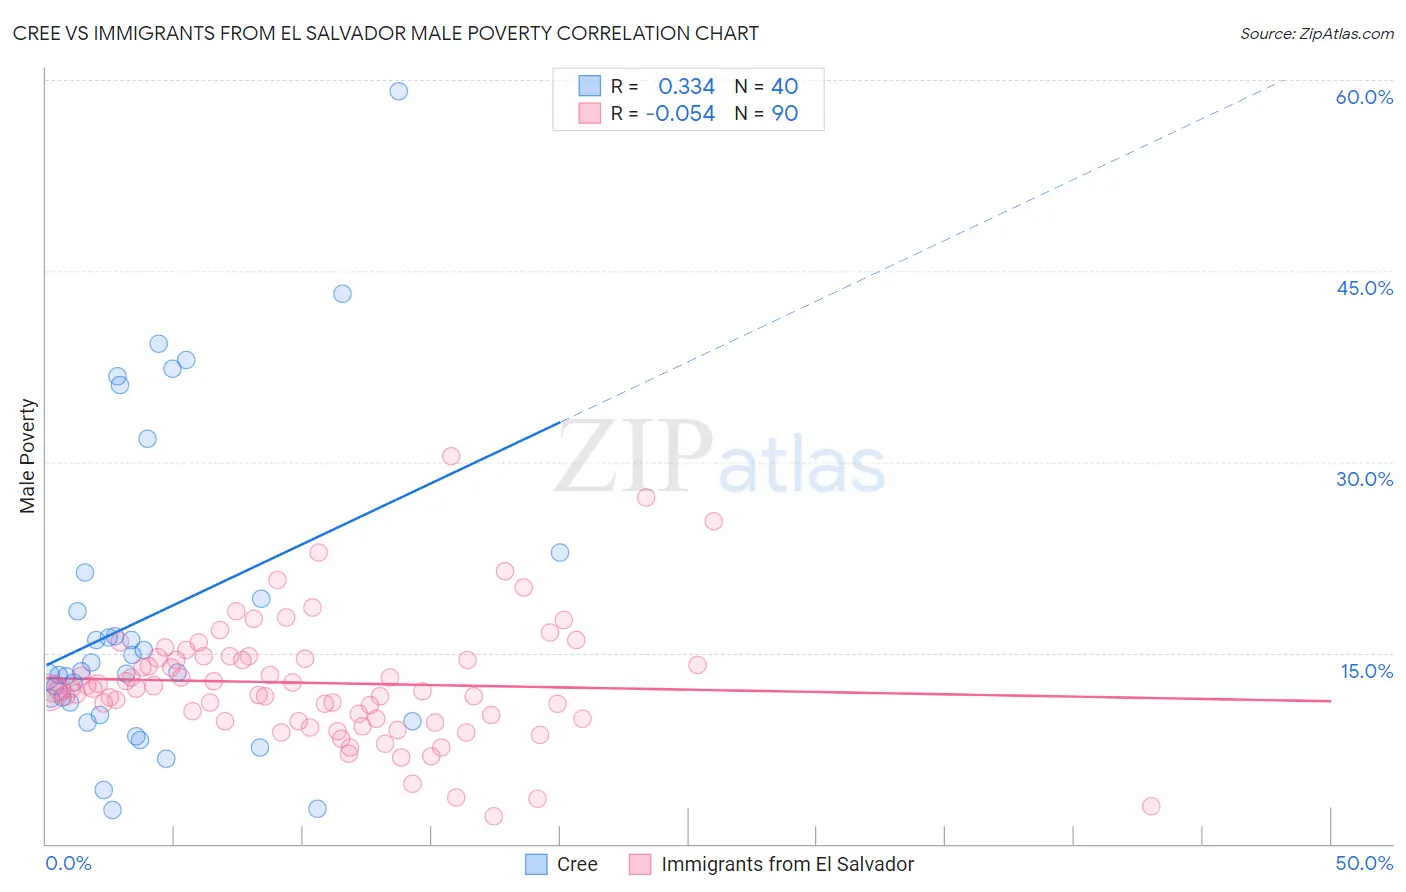
Cree vs Immigrants from El Salvador Male Poverty Correlation Chart
The statistical analysis conducted on geographies consisting of 76,204,291 people shows a mild positive correlation between the proportion of Cree and poverty level among males in the United States with a correlation coefficient (R) of 0.334 and weighted average of 13.3%. Similarly, the statistical analysis conducted on geographies consisting of 357,646,043 people shows a slight negative correlation between the proportion of Immigrants from El Salvador and poverty level among males in the United States with a correlation coefficient (R) of -0.054 and weighted average of 12.8%, a difference of 3.9%.
Male Poverty Correlation Summary
| Measurement | Cree | Immigrants from El Salvador |
| Minimum | 2.7% | 2.2% |
| Maximum | 59.1% | 30.5% |
| Range | 56.4% | 28.3% |
| Mean | 18.0% | 12.6% |
| Median | 13.5% | 12.2% |
| Interquartile 25% (IQ1) | 10.6% | 9.8% |
| Interquartile 75% (IQ3) | 20.2% | 14.6% |
| Interquartile Range (IQR) | 9.6% | 4.8% |
| Standard Deviation (Sample) | 12.5% | 4.8% |
| Standard Deviation (Population) | 12.4% | 4.8% |
Similar Demographics by Male Poverty
Demographics Similar to Cree by Male Poverty
In terms of male poverty, the demographic groups most similar to Cree are Spanish American (13.4%, a difference of 0.030%), Guyanese (13.3%, a difference of 0.47%), Subsaharan African (13.3%, a difference of 0.69%), Immigrants from Jamaica (13.3%, a difference of 0.72%), and Immigrants from Bahamas (13.5%, a difference of 0.78%).
| Demographics | Rating | Rank | Male Poverty |
| Central Americans | 0.1 /100 | #263 | Tragic 13.2% |
| Iroquois | 0.1 /100 | #264 | Tragic 13.2% |
| Jamaicans | 0.1 /100 | #265 | Tragic 13.2% |
| Immigrants | Guyana | 0.1 /100 | #266 | Tragic 13.2% |
| Immigrants | Jamaica | 0.1 /100 | #267 | Tragic 13.3% |
| Sub-Saharan Africans | 0.1 /100 | #268 | Tragic 13.3% |
| Guyanese | 0.0 /100 | #269 | Tragic 13.3% |
| Cree | 0.0 /100 | #270 | Tragic 13.3% |
| Spanish Americans | 0.0 /100 | #271 | Tragic 13.4% |
| Immigrants | Bahamas | 0.0 /100 | #272 | Tragic 13.5% |
| Chickasaw | 0.0 /100 | #273 | Tragic 13.5% |
| Immigrants | West Indies | 0.0 /100 | #274 | Tragic 13.5% |
| Barbadians | 0.0 /100 | #275 | Tragic 13.6% |
| Immigrants | Latin America | 0.0 /100 | #276 | Tragic 13.6% |
| Bangladeshis | 0.0 /100 | #277 | Tragic 13.6% |
Demographics Similar to Immigrants from El Salvador by Male Poverty
In terms of male poverty, the demographic groups most similar to Immigrants from El Salvador are Liberian (12.8%, a difference of 0.30%), Tsimshian (12.8%, a difference of 0.32%), Immigrants from Western Africa (12.9%, a difference of 0.35%), Immigrants from Sudan (12.9%, a difference of 0.41%), and Alaskan Athabascan (12.8%, a difference of 0.42%).
| Demographics | Rating | Rank | Male Poverty |
| Ghanaians | 0.4 /100 | #239 | Tragic 12.7% |
| Immigrants | Middle Africa | 0.4 /100 | #240 | Tragic 12.7% |
| Sudanese | 0.3 /100 | #241 | Tragic 12.8% |
| Nepalese | 0.3 /100 | #242 | Tragic 12.8% |
| Alaskan Athabascans | 0.3 /100 | #243 | Tragic 12.8% |
| Tsimshian | 0.3 /100 | #244 | Tragic 12.8% |
| Liberians | 0.3 /100 | #245 | Tragic 12.8% |
| Immigrants | El Salvador | 0.2 /100 | #246 | Tragic 12.8% |
| Immigrants | Western Africa | 0.2 /100 | #247 | Tragic 12.9% |
| Immigrants | Sudan | 0.2 /100 | #248 | Tragic 12.9% |
| Potawatomi | 0.2 /100 | #249 | Tragic 12.9% |
| Immigrants | Nicaragua | 0.2 /100 | #250 | Tragic 12.9% |
| Immigrants | Cuba | 0.2 /100 | #251 | Tragic 12.9% |
| Immigrants | Ecuador | 0.2 /100 | #252 | Tragic 12.9% |
| Immigrants | Ghana | 0.2 /100 | #253 | Tragic 12.9% |