Immigrants from Trinidad and Tobago vs Immigrants from Belarus Male Poverty
COMPARE
Immigrants from Trinidad and Tobago
Immigrants from Belarus
Male Poverty
Male Poverty Comparison
Immigrants from Trinidad and Tobago
Immigrants from Belarus
13.1%
MALE POVERTY
0.1/ 100
METRIC RATING
257th/ 347
METRIC RANK
10.7%
MALE POVERTY
83.3/ 100
METRIC RATING
131st/ 347
METRIC RANK
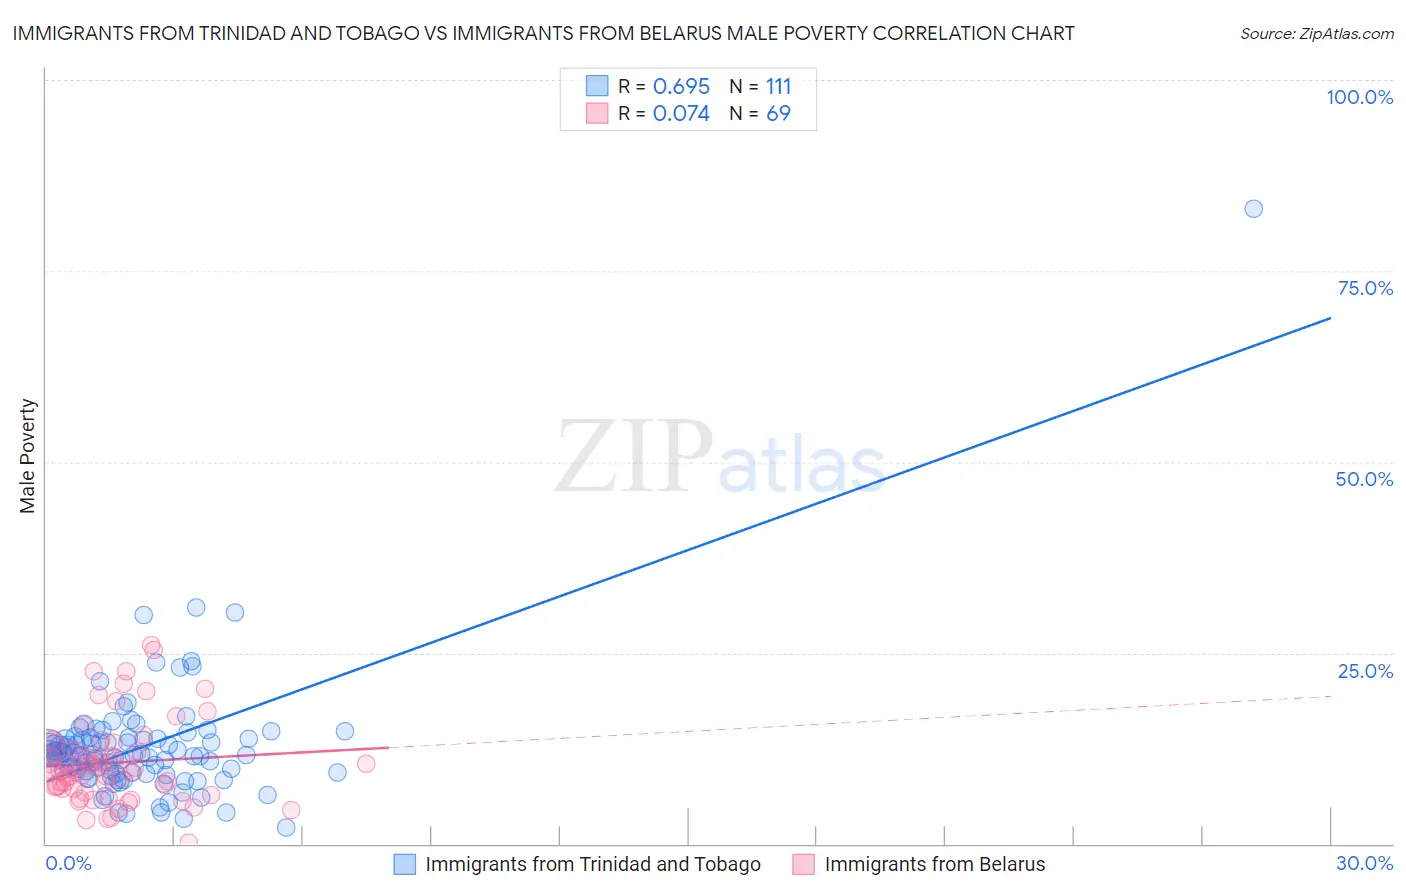
Immigrants from Trinidad and Tobago vs Immigrants from Belarus Male Poverty Correlation Chart
The statistical analysis conducted on geographies consisting of 223,466,412 people shows a significant positive correlation between the proportion of Immigrants from Trinidad and Tobago and poverty level among males in the United States with a correlation coefficient (R) of 0.695 and weighted average of 13.1%. Similarly, the statistical analysis conducted on geographies consisting of 150,164,106 people shows a slight positive correlation between the proportion of Immigrants from Belarus and poverty level among males in the United States with a correlation coefficient (R) of 0.074 and weighted average of 10.7%, a difference of 21.4%.
Male Poverty Correlation Summary
| Measurement | Immigrants from Trinidad and Tobago | Immigrants from Belarus |
| Minimum | 2.1% | 0.12% |
| Maximum | 83.2% | 26.1% |
| Range | 81.1% | 25.9% |
| Mean | 12.7% | 10.6% |
| Median | 11.6% | 9.5% |
| Interquartile 25% (IQ1) | 9.3% | 7.2% |
| Interquartile 75% (IQ3) | 13.7% | 12.5% |
| Interquartile Range (IQR) | 4.4% | 5.3% |
| Standard Deviation (Sample) | 8.4% | 5.5% |
| Standard Deviation (Population) | 8.4% | 5.4% |
Similar Demographics by Male Poverty
Demographics Similar to Immigrants from Trinidad and Tobago by Male Poverty
In terms of male poverty, the demographic groups most similar to Immigrants from Trinidad and Tobago are Cape Verdean (13.1%, a difference of 0.13%), Immigrants from Burma/Myanmar (13.0%, a difference of 0.26%), Cherokee (13.1%, a difference of 0.29%), Ottawa (13.1%, a difference of 0.40%), and Trinidadian and Tobagonian (13.1%, a difference of 0.42%).
| Demographics | Rating | Rank | Male Poverty |
| Immigrants | Nicaragua | 0.2 /100 | #250 | Tragic 12.9% |
| Immigrants | Cuba | 0.2 /100 | #251 | Tragic 12.9% |
| Immigrants | Ecuador | 0.2 /100 | #252 | Tragic 12.9% |
| Immigrants | Ghana | 0.2 /100 | #253 | Tragic 12.9% |
| Mexican American Indians | 0.1 /100 | #254 | Tragic 13.0% |
| Immigrants | Liberia | 0.1 /100 | #255 | Tragic 13.0% |
| Immigrants | Burma/Myanmar | 0.1 /100 | #256 | Tragic 13.0% |
| Immigrants | Trinidad and Tobago | 0.1 /100 | #257 | Tragic 13.1% |
| Cape Verdeans | 0.1 /100 | #258 | Tragic 13.1% |
| Cherokee | 0.1 /100 | #259 | Tragic 13.1% |
| Ottawa | 0.1 /100 | #260 | Tragic 13.1% |
| Trinidadians and Tobagonians | 0.1 /100 | #261 | Tragic 13.1% |
| Spanish American Indians | 0.1 /100 | #262 | Tragic 13.1% |
| Central Americans | 0.1 /100 | #263 | Tragic 13.2% |
| Iroquois | 0.1 /100 | #264 | Tragic 13.2% |
Demographics Similar to Immigrants from Belarus by Male Poverty
In terms of male poverty, the demographic groups most similar to Immigrants from Belarus are Immigrants from Vietnam (10.8%, a difference of 0.050%), Pakistani (10.8%, a difference of 0.060%), New Zealander (10.8%, a difference of 0.070%), Chilean (10.7%, a difference of 0.11%), and Brazilian (10.8%, a difference of 0.11%).
| Demographics | Rating | Rank | Male Poverty |
| French | 86.7 /100 | #124 | Excellent 10.7% |
| Immigrants | Norway | 86.0 /100 | #125 | Excellent 10.7% |
| Immigrants | Ukraine | 84.3 /100 | #126 | Excellent 10.7% |
| Puget Sound Salish | 84.3 /100 | #127 | Excellent 10.7% |
| Immigrants | Western Europe | 84.2 /100 | #128 | Excellent 10.7% |
| Immigrants | Peru | 84.1 /100 | #129 | Excellent 10.7% |
| Chileans | 83.9 /100 | #130 | Excellent 10.7% |
| Immigrants | Belarus | 83.3 /100 | #131 | Excellent 10.7% |
| Immigrants | Vietnam | 83.0 /100 | #132 | Excellent 10.8% |
| Pakistanis | 83.0 /100 | #133 | Excellent 10.8% |
| New Zealanders | 82.9 /100 | #134 | Excellent 10.8% |
| Brazilians | 82.7 /100 | #135 | Excellent 10.8% |
| Immigrants | Israel | 80.9 /100 | #136 | Excellent 10.8% |
| Immigrants | Switzerland | 79.2 /100 | #137 | Good 10.8% |
| Yugoslavians | 78.2 /100 | #138 | Good 10.8% |