Immigrants from Albania vs Immigrants from Belarus Male Poverty
COMPARE
Immigrants from Albania
Immigrants from Belarus
Male Poverty
Male Poverty Comparison
Immigrants from Albania
Immigrants from Belarus
11.1%
MALE POVERTY
55.3/ 100
METRIC RATING
166th/ 347
METRIC RANK
10.7%
MALE POVERTY
83.3/ 100
METRIC RATING
131st/ 347
METRIC RANK
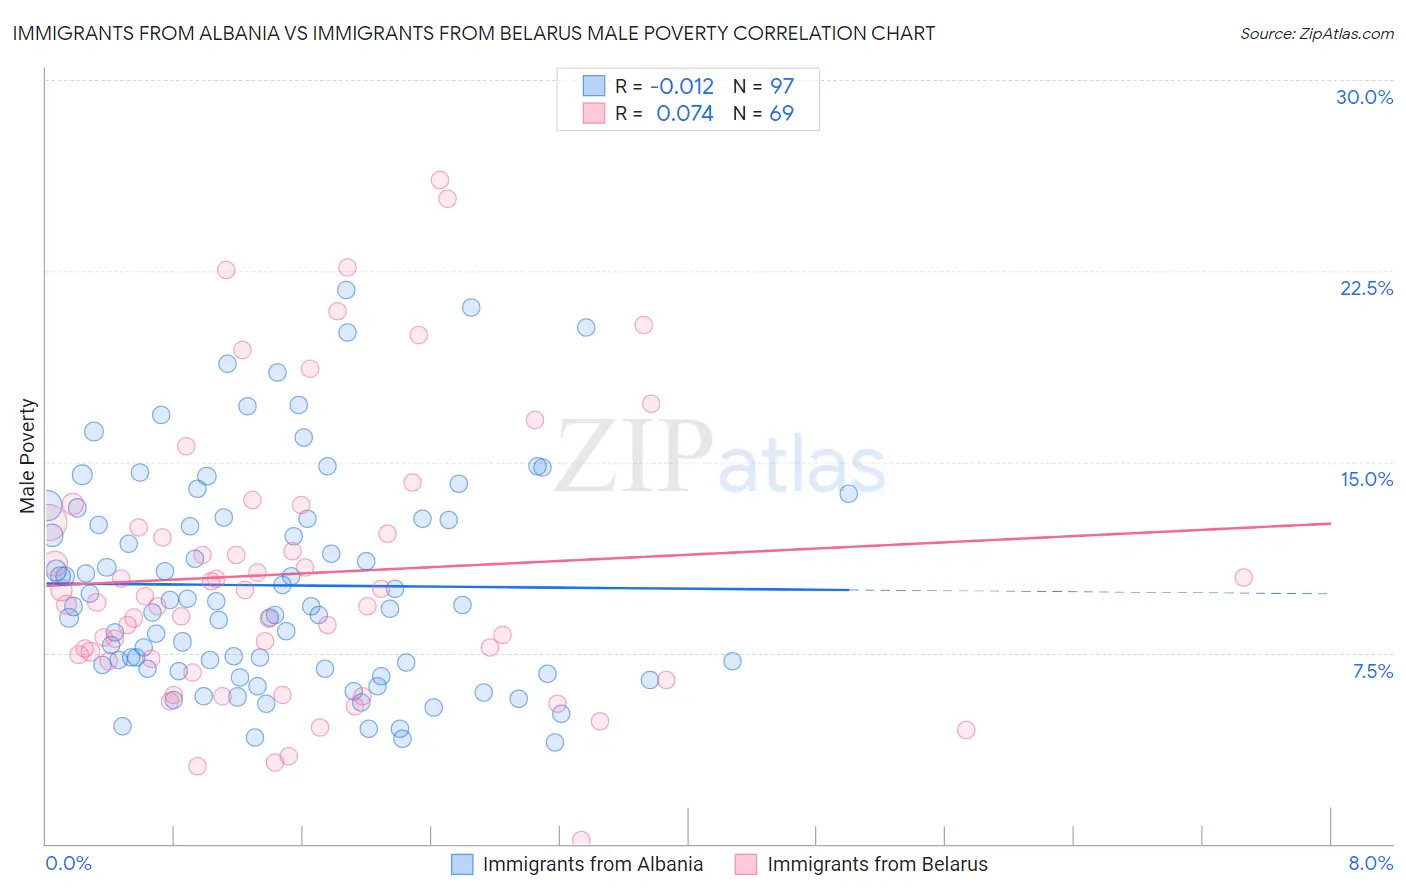
Immigrants from Albania vs Immigrants from Belarus Male Poverty Correlation Chart
The statistical analysis conducted on geographies consisting of 119,357,125 people shows no correlation between the proportion of Immigrants from Albania and poverty level among males in the United States with a correlation coefficient (R) of -0.012 and weighted average of 11.1%. Similarly, the statistical analysis conducted on geographies consisting of 150,164,106 people shows a slight positive correlation between the proportion of Immigrants from Belarus and poverty level among males in the United States with a correlation coefficient (R) of 0.074 and weighted average of 10.7%, a difference of 3.6%.
Male Poverty Correlation Summary
| Measurement | Immigrants from Albania | Immigrants from Belarus |
| Minimum | 4.0% | 0.12% |
| Maximum | 21.8% | 26.1% |
| Range | 17.8% | 25.9% |
| Mean | 10.2% | 10.6% |
| Median | 9.3% | 9.5% |
| Interquartile 25% (IQ1) | 6.9% | 7.2% |
| Interquartile 75% (IQ3) | 12.8% | 12.5% |
| Interquartile Range (IQR) | 5.9% | 5.3% |
| Standard Deviation (Sample) | 4.2% | 5.5% |
| Standard Deviation (Population) | 4.2% | 5.4% |
Similar Demographics by Male Poverty
Demographics Similar to Immigrants from Albania by Male Poverty
In terms of male poverty, the demographic groups most similar to Immigrants from Albania are Immigrants from Spain (11.1%, a difference of 0.020%), Hungarian (11.1%, a difference of 0.020%), Immigrants from Portugal (11.1%, a difference of 0.040%), Immigrants from Colombia (11.1%, a difference of 0.11%), and White/Caucasian (11.1%, a difference of 0.14%).
| Demographics | Rating | Rank | Male Poverty |
| Taiwanese | 62.7 /100 | #159 | Good 11.0% |
| Soviet Union | 60.3 /100 | #160 | Good 11.1% |
| Immigrants | Northern Africa | 59.7 /100 | #161 | Average 11.1% |
| Immigrants | Chile | 57.4 /100 | #162 | Average 11.1% |
| Whites/Caucasians | 56.7 /100 | #163 | Average 11.1% |
| Ethiopians | 56.7 /100 | #164 | Average 11.1% |
| Immigrants | Spain | 55.5 /100 | #165 | Average 11.1% |
| Immigrants | Albania | 55.3 /100 | #166 | Average 11.1% |
| Hungarians | 55.1 /100 | #167 | Average 11.1% |
| Immigrants | Portugal | 54.9 /100 | #168 | Average 11.1% |
| Immigrants | Colombia | 54.2 /100 | #169 | Average 11.1% |
| South Americans | 53.8 /100 | #170 | Average 11.1% |
| Uruguayans | 51.0 /100 | #171 | Average 11.2% |
| Immigrants | Ethiopia | 50.7 /100 | #172 | Average 11.2% |
| Pennsylvania Germans | 50.5 /100 | #173 | Average 11.2% |
Demographics Similar to Immigrants from Belarus by Male Poverty
In terms of male poverty, the demographic groups most similar to Immigrants from Belarus are Immigrants from Vietnam (10.8%, a difference of 0.050%), Pakistani (10.8%, a difference of 0.060%), New Zealander (10.8%, a difference of 0.070%), Chilean (10.7%, a difference of 0.11%), and Brazilian (10.8%, a difference of 0.11%).
| Demographics | Rating | Rank | Male Poverty |
| French | 86.7 /100 | #124 | Excellent 10.7% |
| Immigrants | Norway | 86.0 /100 | #125 | Excellent 10.7% |
| Immigrants | Ukraine | 84.3 /100 | #126 | Excellent 10.7% |
| Puget Sound Salish | 84.3 /100 | #127 | Excellent 10.7% |
| Immigrants | Western Europe | 84.2 /100 | #128 | Excellent 10.7% |
| Immigrants | Peru | 84.1 /100 | #129 | Excellent 10.7% |
| Chileans | 83.9 /100 | #130 | Excellent 10.7% |
| Immigrants | Belarus | 83.3 /100 | #131 | Excellent 10.7% |
| Immigrants | Vietnam | 83.0 /100 | #132 | Excellent 10.8% |
| Pakistanis | 83.0 /100 | #133 | Excellent 10.8% |
| New Zealanders | 82.9 /100 | #134 | Excellent 10.8% |
| Brazilians | 82.7 /100 | #135 | Excellent 10.8% |
| Immigrants | Israel | 80.9 /100 | #136 | Excellent 10.8% |
| Immigrants | Switzerland | 79.2 /100 | #137 | Good 10.8% |
| Yugoslavians | 78.2 /100 | #138 | Good 10.8% |