Lebanese vs Somali Single Male Poverty
COMPARE
Lebanese
Somali
Single Male Poverty
Single Male Poverty Comparison
Lebanese
Somalis
13.2%
SINGLE MALE POVERTY
6.6/ 100
METRIC RATING
228th/ 347
METRIC RANK
13.2%
SINGLE MALE POVERTY
9.1/ 100
METRIC RATING
224th/ 347
METRIC RANK
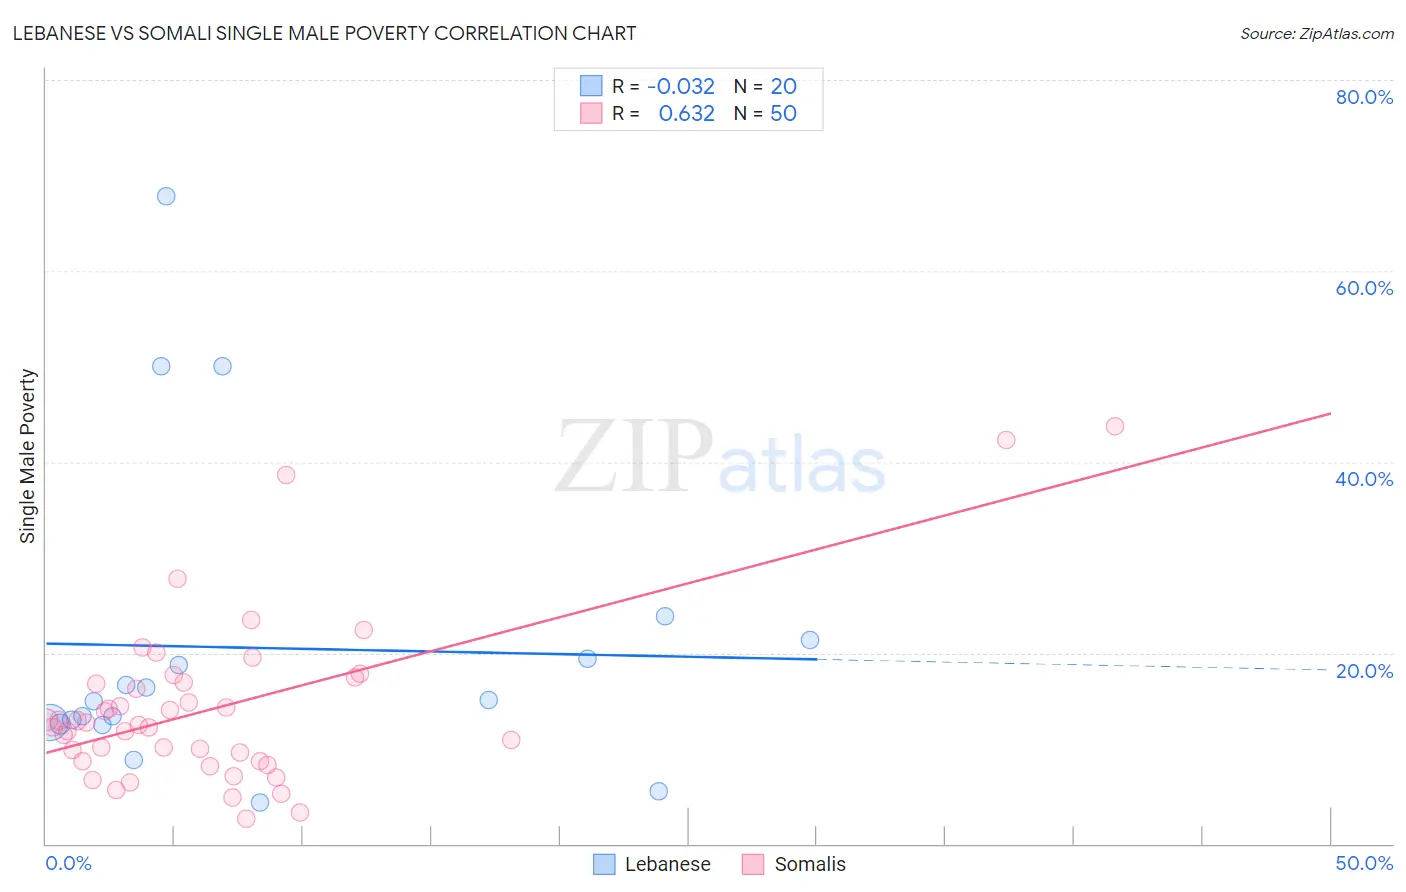
Lebanese vs Somali Single Male Poverty Correlation Chart
The statistical analysis conducted on geographies consisting of 352,480,661 people shows no correlation between the proportion of Lebanese and poverty level among single males in the United States with a correlation coefficient (R) of -0.032 and weighted average of 13.2%. Similarly, the statistical analysis conducted on geographies consisting of 95,264,577 people shows a significant positive correlation between the proportion of Somalis and poverty level among single males in the United States with a correlation coefficient (R) of 0.632 and weighted average of 13.2%, a difference of 0.43%.
Single Male Poverty Correlation Summary
| Measurement | Lebanese | Somali |
| Minimum | 4.3% | 2.6% |
| Maximum | 67.9% | 43.7% |
| Range | 63.6% | 41.1% |
| Mean | 20.5% | 14.2% |
| Median | 15.0% | 12.6% |
| Interquartile 25% (IQ1) | 12.6% | 8.7% |
| Interquartile 75% (IQ3) | 20.4% | 16.8% |
| Interquartile Range (IQR) | 7.8% | 8.1% |
| Standard Deviation (Sample) | 16.3% | 8.7% |
| Standard Deviation (Population) | 15.9% | 8.6% |
Demographics Similar to Lebanese and Somalis by Single Male Poverty
In terms of single male poverty, the demographic groups most similar to Lebanese are Haitian (13.2%, a difference of 0.080%), European (13.3%, a difference of 0.090%), Ghanaian (13.3%, a difference of 0.12%), Jamaican (13.2%, a difference of 0.21%), and Slavic (13.3%, a difference of 0.30%). Similarly, the demographic groups most similar to Somalis are Immigrants from the Azores (13.2%, a difference of 0.030%), Immigrants from Denmark (13.2%, a difference of 0.050%), Immigrants from Western Europe (13.2%, a difference of 0.15%), Jamaican (13.2%, a difference of 0.22%), and New Zealander (13.2%, a difference of 0.24%).
| Demographics | Rating | Rank | Single Male Poverty |
| Austrians | 13.9 /100 | #216 | Poor 13.1% |
| Bermudans | 13.0 /100 | #217 | Poor 13.1% |
| Scandinavians | 12.9 /100 | #218 | Poor 13.1% |
| Immigrants | Burma/Myanmar | 12.6 /100 | #219 | Poor 13.1% |
| Central Americans | 10.9 /100 | #220 | Poor 13.2% |
| New Zealanders | 10.7 /100 | #221 | Poor 13.2% |
| Immigrants | Western Europe | 10.0 /100 | #222 | Poor 13.2% |
| Immigrants | Azores | 9.3 /100 | #223 | Tragic 13.2% |
| Somalis | 9.1 /100 | #224 | Tragic 13.2% |
| Immigrants | Denmark | 8.7 /100 | #225 | Tragic 13.2% |
| Jamaicans | 7.7 /100 | #226 | Tragic 13.2% |
| Haitians | 7.0 /100 | #227 | Tragic 13.2% |
| Lebanese | 6.6 /100 | #228 | Tragic 13.2% |
| Europeans | 6.2 /100 | #229 | Tragic 13.3% |
| Ghanaians | 6.1 /100 | #230 | Tragic 13.3% |
| Slavs | 5.3 /100 | #231 | Tragic 13.3% |
| Immigrants | Caribbean | 5.0 /100 | #232 | Tragic 13.3% |
| British | 4.0 /100 | #233 | Tragic 13.3% |
| Canadians | 4.0 /100 | #234 | Tragic 13.3% |
| Bangladeshis | 3.7 /100 | #235 | Tragic 13.3% |
| Luxembourgers | 3.6 /100 | #236 | Tragic 13.4% |