Colville vs Somali Single Mother Poverty
COMPARE
Colville
Somali
Single Mother Poverty
Single Mother Poverty Comparison
Colville
Somalis
39.3%
SINGLE MOTHER POVERTY
0.0/ 100
METRIC RATING
341st/ 347
METRIC RANK
32.6%
SINGLE MOTHER POVERTY
0.0/ 100
METRIC RATING
288th/ 347
METRIC RANK
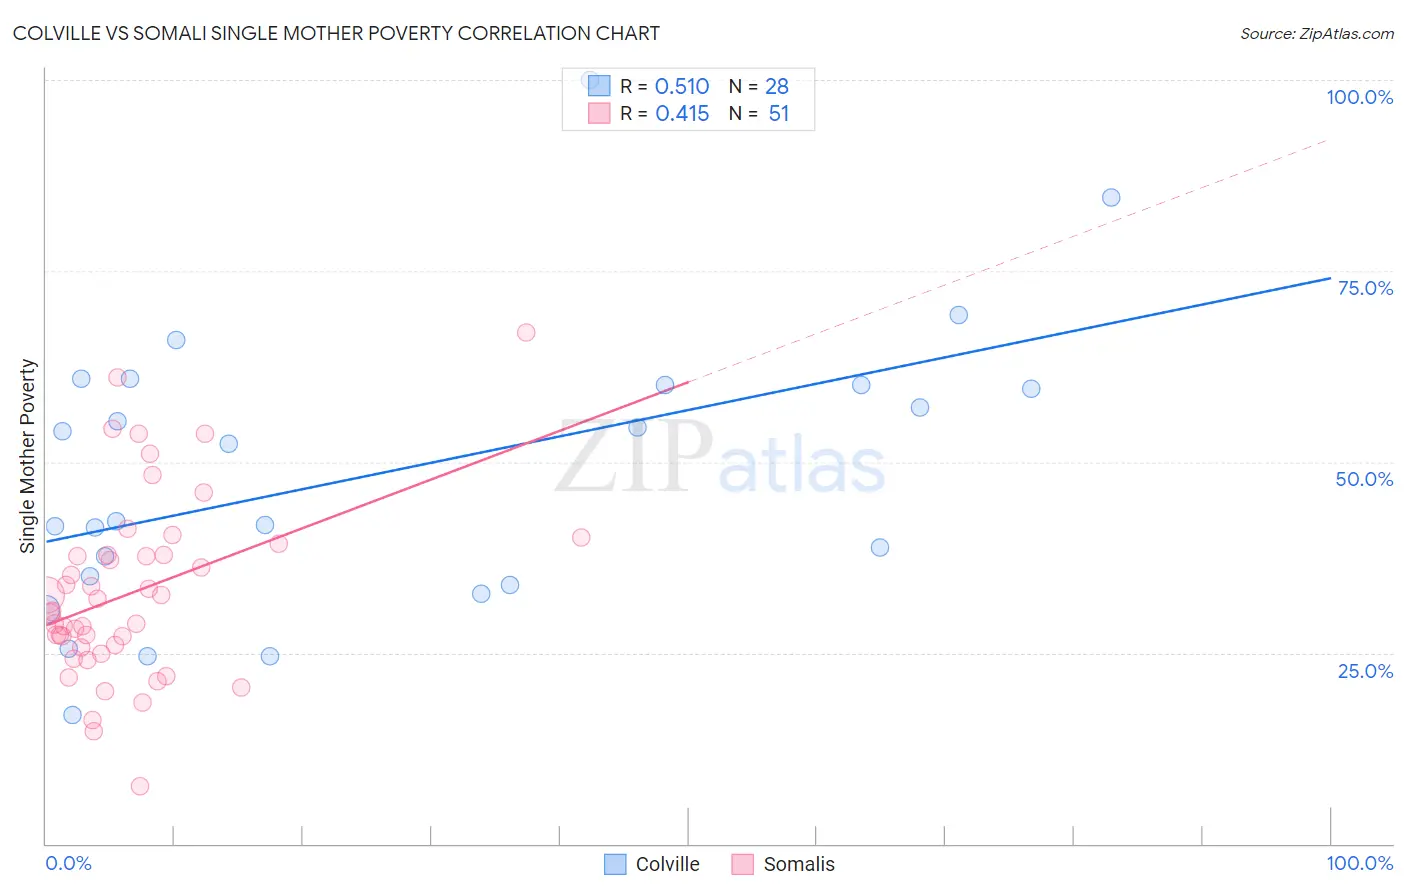
Colville vs Somali Single Mother Poverty Correlation Chart
The statistical analysis conducted on geographies consisting of 34,541,022 people shows a substantial positive correlation between the proportion of Colville and poverty level among single mothers in the United States with a correlation coefficient (R) of 0.510 and weighted average of 39.3%. Similarly, the statistical analysis conducted on geographies consisting of 98,871,600 people shows a moderate positive correlation between the proportion of Somalis and poverty level among single mothers in the United States with a correlation coefficient (R) of 0.415 and weighted average of 32.6%, a difference of 20.6%.
Single Mother Poverty Correlation Summary
| Measurement | Colville | Somali |
| Minimum | 16.8% | 7.5% |
| Maximum | 100.0% | 66.9% |
| Range | 83.2% | 59.4% |
| Mean | 48.6% | 33.0% |
| Median | 47.3% | 30.4% |
| Interquartile 25% (IQ1) | 34.5% | 25.7% |
| Interquartile 75% (IQ3) | 60.0% | 37.9% |
| Interquartile Range (IQR) | 25.5% | 12.2% |
| Standard Deviation (Sample) | 18.9% | 11.9% |
| Standard Deviation (Population) | 18.5% | 11.8% |
Similar Demographics by Single Mother Poverty
Demographics Similar to Colville by Single Mother Poverty
In terms of single mother poverty, the demographic groups most similar to Colville are Sioux (38.8%, a difference of 1.3%), Crow (38.6%, a difference of 1.7%), Pima (38.6%, a difference of 1.8%), Immigrants from Yemen (38.5%, a difference of 2.0%), and Cheyenne (38.5%, a difference of 2.1%).
| Demographics | Rating | Rank | Single Mother Poverty |
| Menominee | 0.0 /100 | #333 | Tragic 37.1% |
| Pueblo | 0.0 /100 | #334 | Tragic 37.2% |
| Yuman | 0.0 /100 | #335 | Tragic 37.8% |
| Cheyenne | 0.0 /100 | #336 | Tragic 38.5% |
| Immigrants | Yemen | 0.0 /100 | #337 | Tragic 38.5% |
| Pima | 0.0 /100 | #338 | Tragic 38.6% |
| Crow | 0.0 /100 | #339 | Tragic 38.6% |
| Sioux | 0.0 /100 | #340 | Tragic 38.8% |
| Colville | 0.0 /100 | #341 | Tragic 39.3% |
| Navajo | 0.0 /100 | #342 | Tragic 40.2% |
| Cajuns | 0.0 /100 | #343 | Tragic 40.3% |
| Tohono O'odham | 0.0 /100 | #344 | Tragic 43.0% |
| Lumbee | 0.0 /100 | #345 | Tragic 43.2% |
| Houma | 0.0 /100 | #346 | Tragic 43.5% |
| Puerto Ricans | 0.0 /100 | #347 | Tragic 44.5% |
Demographics Similar to Somalis by Single Mother Poverty
In terms of single mother poverty, the demographic groups most similar to Somalis are U.S. Virgin Islander (32.6%, a difference of 0.030%), Osage (32.6%, a difference of 0.14%), Immigrants from Dominica (32.5%, a difference of 0.23%), Yup'ik (32.5%, a difference of 0.35%), and Immigrants from Latin America (32.4%, a difference of 0.43%).
| Demographics | Rating | Rank | Single Mother Poverty |
| Cree | 0.0 /100 | #281 | Tragic 32.2% |
| Immigrants | Azores | 0.0 /100 | #282 | Tragic 32.2% |
| Spanish Americans | 0.0 /100 | #283 | Tragic 32.3% |
| Indonesians | 0.0 /100 | #284 | Tragic 32.4% |
| Immigrants | Latin America | 0.0 /100 | #285 | Tragic 32.4% |
| Yup'ik | 0.0 /100 | #286 | Tragic 32.5% |
| Immigrants | Dominica | 0.0 /100 | #287 | Tragic 32.5% |
| Somalis | 0.0 /100 | #288 | Tragic 32.6% |
| U.S. Virgin Islanders | 0.0 /100 | #289 | Tragic 32.6% |
| Osage | 0.0 /100 | #290 | Tragic 32.6% |
| Guatemalans | 0.0 /100 | #291 | Tragic 32.9% |
| Shoshone | 0.0 /100 | #292 | Tragic 32.9% |
| Aleuts | 0.0 /100 | #293 | Tragic 32.9% |
| French American Indians | 0.0 /100 | #294 | Tragic 33.1% |
| Yaqui | 0.0 /100 | #295 | Tragic 33.1% |