Immigrants from Hungary vs Somali Single Male Poverty
COMPARE
Immigrants from Hungary
Somali
Single Male Poverty
Single Male Poverty Comparison
Immigrants from Hungary
Somalis
12.6%
SINGLE MALE POVERTY
71.9/ 100
METRIC RATING
151st/ 347
METRIC RANK
13.2%
SINGLE MALE POVERTY
9.1/ 100
METRIC RATING
224th/ 347
METRIC RANK
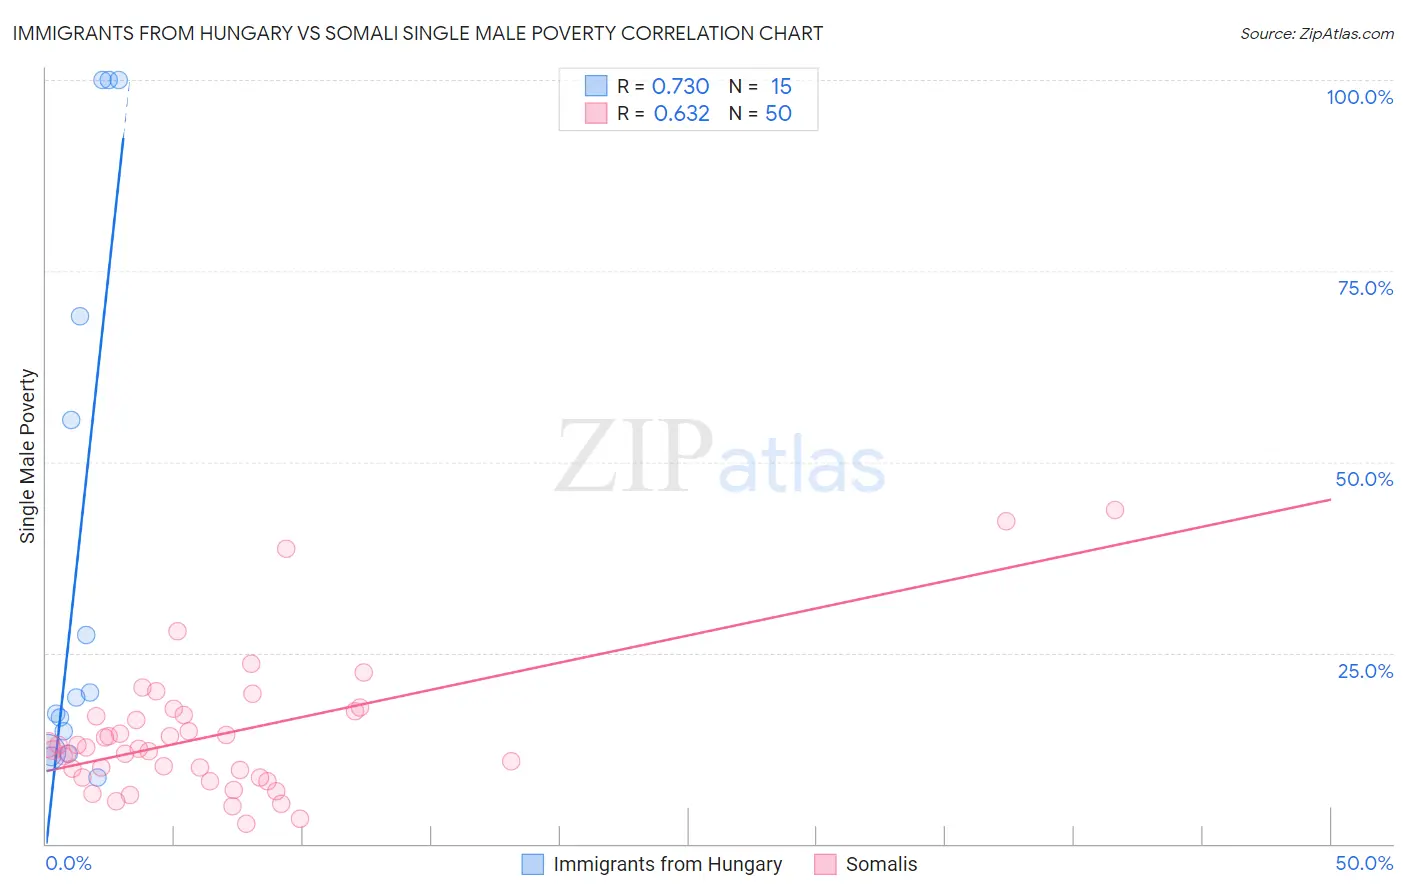
Immigrants from Hungary vs Somali Single Male Poverty Correlation Chart
The statistical analysis conducted on geographies consisting of 178,525,850 people shows a strong positive correlation between the proportion of Immigrants from Hungary and poverty level among single males in the United States with a correlation coefficient (R) of 0.730 and weighted average of 12.6%. Similarly, the statistical analysis conducted on geographies consisting of 95,264,577 people shows a significant positive correlation between the proportion of Somalis and poverty level among single males in the United States with a correlation coefficient (R) of 0.632 and weighted average of 13.2%, a difference of 4.3%.
Single Male Poverty Correlation Summary
| Measurement | Immigrants from Hungary | Somali |
| Minimum | 8.7% | 2.6% |
| Maximum | 100.0% | 43.7% |
| Range | 91.3% | 41.1% |
| Mean | 38.9% | 14.2% |
| Median | 19.1% | 12.6% |
| Interquartile 25% (IQ1) | 11.9% | 8.7% |
| Interquartile 75% (IQ3) | 69.1% | 16.8% |
| Interquartile Range (IQR) | 57.2% | 8.1% |
| Standard Deviation (Sample) | 35.8% | 8.7% |
| Standard Deviation (Population) | 34.6% | 8.6% |
Similar Demographics by Single Male Poverty
Demographics Similar to Immigrants from Hungary by Single Male Poverty
In terms of single male poverty, the demographic groups most similar to Immigrants from Hungary are Immigrants from Panama (12.6%, a difference of 0.010%), Australian (12.6%, a difference of 0.030%), Sierra Leonean (12.6%, a difference of 0.070%), Immigrants (12.7%, a difference of 0.12%), and Yugoslavian (12.6%, a difference of 0.14%).
| Demographics | Rating | Rank | Single Male Poverty |
| Hawaiians | 75.1 /100 | #144 | Good 12.6% |
| Immigrants | Lebanon | 75.0 /100 | #145 | Good 12.6% |
| Native Hawaiians | 75.0 /100 | #146 | Good 12.6% |
| Malaysians | 74.8 /100 | #147 | Good 12.6% |
| Yugoslavians | 73.9 /100 | #148 | Good 12.6% |
| Sierra Leoneans | 73.0 /100 | #149 | Good 12.6% |
| Immigrants | Panama | 72.1 /100 | #150 | Good 12.6% |
| Immigrants | Hungary | 71.9 /100 | #151 | Good 12.6% |
| Australians | 71.4 /100 | #152 | Good 12.6% |
| Immigrants | Immigrants | 70.1 /100 | #153 | Good 12.7% |
| Immigrants | Scotland | 68.9 /100 | #154 | Good 12.7% |
| Immigrants | Spain | 68.7 /100 | #155 | Good 12.7% |
| Vietnamese | 67.9 /100 | #156 | Good 12.7% |
| Latvians | 67.9 /100 | #157 | Good 12.7% |
| Immigrants | Middle Africa | 64.9 /100 | #158 | Good 12.7% |
Demographics Similar to Somalis by Single Male Poverty
In terms of single male poverty, the demographic groups most similar to Somalis are Immigrants from the Azores (13.2%, a difference of 0.030%), Immigrants from Denmark (13.2%, a difference of 0.050%), Immigrants from Western Europe (13.2%, a difference of 0.15%), Jamaican (13.2%, a difference of 0.22%), and New Zealander (13.2%, a difference of 0.24%).
| Demographics | Rating | Rank | Single Male Poverty |
| Bermudans | 13.0 /100 | #217 | Poor 13.1% |
| Scandinavians | 12.9 /100 | #218 | Poor 13.1% |
| Immigrants | Burma/Myanmar | 12.6 /100 | #219 | Poor 13.1% |
| Central Americans | 10.9 /100 | #220 | Poor 13.2% |
| New Zealanders | 10.7 /100 | #221 | Poor 13.2% |
| Immigrants | Western Europe | 10.0 /100 | #222 | Poor 13.2% |
| Immigrants | Azores | 9.3 /100 | #223 | Tragic 13.2% |
| Somalis | 9.1 /100 | #224 | Tragic 13.2% |
| Immigrants | Denmark | 8.7 /100 | #225 | Tragic 13.2% |
| Jamaicans | 7.7 /100 | #226 | Tragic 13.2% |
| Haitians | 7.0 /100 | #227 | Tragic 13.2% |
| Lebanese | 6.6 /100 | #228 | Tragic 13.2% |
| Europeans | 6.2 /100 | #229 | Tragic 13.3% |
| Ghanaians | 6.1 /100 | #230 | Tragic 13.3% |
| Slavs | 5.3 /100 | #231 | Tragic 13.3% |