Vietnamese vs Somali Single Male Poverty

COMPARE

Vietnamese
Race
Ancestry
AfghanAfricanAlaska NativeAlaskan AthabascanAlbanianAleutAlsatianAmericanApacheArabArapahoArgentineanArmenianAssyrian/Chaldean/SyriacAustralianAustrianBahamianBangladeshiBarbadianBasqueBelgianBelizeanBermudanBhutaneseBlackfeetBolivianBrazilianBritishBritish West IndianBulgarianBurmeseCajunCambodianCanadianCape VerdeanCarpatho RusynCelticCentral AmericanCentral American IndianCherokeeCheyenneChickasawChileanChineseChippewaChoctawColombianColvilleComancheCosta RicanCreeCreekCroatianCrowCubanCypriotCzechCzechoslovakianDanishDelawareDominicanDutchDutch West IndianEastern EuropeanEcuadorianEgyptianEnglishEstonianEthiopianEuropeanFijianFilipinoFinnishFrenchFrench American IndianFrench CanadianGermanGerman RussianGhanaianGreekGuamanian/ChamorroGuatemalanGuyaneseHaitianHmongHonduranHopiHoumaHungarianIcelanderIndian (Asian)IndonesianInupiatIranianIraqiIrishIroquoisIsraeliItalianJamaicanJapaneseJordanianKenyanKiowaKoreanLaotianLatvianLebaneseLiberianLithuanianLumbeeLuxembourgerMacedonianMalaysianMalteseMarshalleseMenomineeMexicanMexican American IndianMongolianMoroccanNative HawaiianNavajoNepaleseNew ZealanderNicaraguanNigerianNorthern EuropeanNorwegianOkinawanOsageOttawaPaiutePakistaniPalestinianPanamanianParaguayanPennsylvania GermanPeruvianPimaPolishPortuguesePotawatomiPuebloPuerto RicanPuget Sound SalishRomanianRussianSalvadoranSamoanScandinavianScotch-IrishScottishSeminoleSenegaleseSerbianShoshoneSierra LeoneanSiouxSlavicSlovakSloveneSouth AfricanSouth AmericanSouth American IndianSoviet UnionSpaniardSpanishSpanish AmericanSpanish American IndianSri LankanSubsaharan AfricanSudaneseSwedishSwissSyrianTaiwaneseThaiTlingit-HaidaTohono O'OdhamTonganTrinidadian and TobagonianTsimshianTurkishU.S. Virgin IslanderUgandanUkrainianUruguayanUteVenezuelanVietnameseWelshWest IndianYakamaYaquiYugoslavianYumanYup'ikZimbabwean
Immigration
NonimmigrantsImmigrantsAfghanistanAfricaAlbaniaArgentinaArmeniaAsiaAustraliaAustriaBahamasBangladeshBarbadosBelarusBelgiumBelizeBoliviaBosnia and HerzegovinaBrazilBulgariaBurma/MyanmarCabo VerdeCambodiaCameroonCanadaCaribbeanCentral AmericaChileChinaColombiaCongoCosta RicaCroatiaCubaCzechoslovakiaDenmarkDominicaDominican RepublicEastern AfricaEastern AsiaEastern EuropeEcuadorEgyptEl SalvadorEnglandEritreaEthiopiaEuropeFijiFranceGermanyGhanaGreeceGrenadaGuatemalaGuyanaHaitiHondurasHong KongHungaryIndiaIndonesiaIranIraqIrelandIsraelItalyJamaicaJapanJordanKazakhstanKenyaKoreaKuwaitLaosLatin AmericaLatviaLebanonLiberiaLithuaniaMalaysiaMexicoMicronesiaMiddle AfricaMoldovaMoroccoNepalNetherlandsNicaraguaNigeriaNorth AmericaNorth MacedoniaNorthern AfricaNorthern EuropeNorwayOceaniaPakistanPanamaPeruPhilippinesPolandPortugalRomaniaRussiaSaudi ArabiaScotlandSenegalSerbiaSierra LeoneSingaporeSomaliaSouth AfricaSouth AmericaSouth Central AsiaSouth Eastern AsiaSouthern EuropeSpainSri LankaSt. Vincent and the GrenadinesSudanSwedenSwitzerlandSyriaTaiwanThailandTrinidad and TobagoTurkeyUgandaUkraineUruguayUzbekistanVenezuelaVietnamWest IndiesWestern AfricaWestern AsiaWestern EuropeYemenZaireZimbabweAzores
Somali
Race
Ancestry
AfghanAfricanAlaska NativeAlaskan AthabascanAlbanianAleutAlsatianAmericanApacheArabArapahoArgentineanArmenianAssyrian/Chaldean/SyriacAustralianAustrianBahamianBangladeshiBarbadianBasqueBelgianBelizeanBermudanBhutaneseBlackfeetBolivianBrazilianBritishBritish West IndianBulgarianBurmeseCajunCambodianCanadianCape VerdeanCarpatho RusynCelticCentral AmericanCentral American IndianCherokeeCheyenneChickasawChileanChineseChippewaChoctawColombianColvilleComancheCosta RicanCreeCreekCroatianCrowCubanCypriotCzechCzechoslovakianDanishDelawareDominicanDutchDutch West IndianEastern EuropeanEcuadorianEgyptianEnglishEstonianEthiopianEuropeanFijianFilipinoFinnishFrenchFrench American IndianFrench CanadianGermanGerman RussianGhanaianGreekGuamanian/ChamorroGuatemalanGuyaneseHaitianHmongHonduranHopiHoumaHungarianIcelanderIndian (Asian)IndonesianInupiatIranianIraqiIrishIroquoisIsraeliItalianJamaicanJapaneseJordanianKenyanKiowaKoreanLaotianLatvianLebaneseLiberianLithuanianLumbeeLuxembourgerMacedonianMalaysianMalteseMarshalleseMenomineeMexicanMexican American IndianMongolianMoroccanNative HawaiianNavajoNepaleseNew ZealanderNicaraguanNigerianNorthern EuropeanNorwegianOkinawanOsageOttawaPaiutePakistaniPalestinianPanamanianParaguayanPennsylvania GermanPeruvianPimaPolishPortuguesePotawatomiPuebloPuerto RicanPuget Sound SalishRomanianRussianSalvadoranSamoanScandinavianScotch-IrishScottishSeminoleSenegaleseSerbianShoshoneSierra LeoneanSiouxSlavicSlovakSloveneSomaliSouth AfricanSouth AmericanSouth American IndianSoviet UnionSpaniardSpanishSpanish AmericanSpanish American IndianSri LankanSubsaharan AfricanSudaneseSwedishSwissSyrianTaiwaneseThaiTlingit-HaidaTohono O'OdhamTonganTrinidadian and TobagonianTsimshianTurkishU.S. Virgin IslanderUgandanUkrainianUruguayanUteVenezuelanWelshWest IndianYakamaYaquiYugoslavianYumanYup'ikZimbabwean
Immigration
NonimmigrantsImmigrantsAfghanistanAfricaAlbaniaArgentinaArmeniaAsiaAustraliaAustriaBahamasBangladeshBarbadosBelarusBelgiumBelizeBoliviaBosnia and HerzegovinaBrazilBulgariaBurma/MyanmarCabo VerdeCambodiaCameroonCanadaCaribbeanCentral AmericaChileChinaColombiaCongoCosta RicaCroatiaCubaCzechoslovakiaDenmarkDominicaDominican RepublicEastern AfricaEastern AsiaEastern EuropeEcuadorEgyptEl SalvadorEnglandEritreaEthiopiaEuropeFijiFranceGermanyGhanaGreeceGrenadaGuatemalaGuyanaHaitiHondurasHong KongHungaryIndiaIndonesiaIranIraqIrelandIsraelItalyJamaicaJapanJordanKazakhstanKenyaKoreaKuwaitLaosLatin AmericaLatviaLebanonLiberiaLithuaniaMalaysiaMexicoMicronesiaMiddle AfricaMoldovaMoroccoNepalNetherlandsNicaraguaNigeriaNorth AmericaNorth MacedoniaNorthern AfricaNorthern EuropeNorwayOceaniaPakistanPanamaPeruPhilippinesPolandPortugalRomaniaRussiaSaudi ArabiaScotlandSenegalSerbiaSierra LeoneSingaporeSomaliaSouth AfricaSouth AmericaSouth Central AsiaSouth Eastern AsiaSouthern EuropeSpainSri LankaSt. Vincent and the GrenadinesSudanSwedenSwitzerlandSyriaTaiwanThailandTrinidad and TobagoTurkeyUgandaUkraineUruguayUzbekistanVenezuelaVietnamWest IndiesWestern AfricaWestern AsiaWestern EuropeYemenZaireZimbabweAzores
Single Male Poverty
Income
Poverty
Unemployment
Labor Participation
Family Structure
Vehicle Availability
Education Level
Disability

Single Male Poverty Comparison

Vietnamese

Somalis

Good
Tragic
12.7%
SINGLE MALE POVERTY
67.9/ 100
METRIC RATING
156th/ 347
METRIC RANK
13.2%
SINGLE MALE POVERTY
9.1/ 100
METRIC RATING
224th/ 347
METRIC RANK

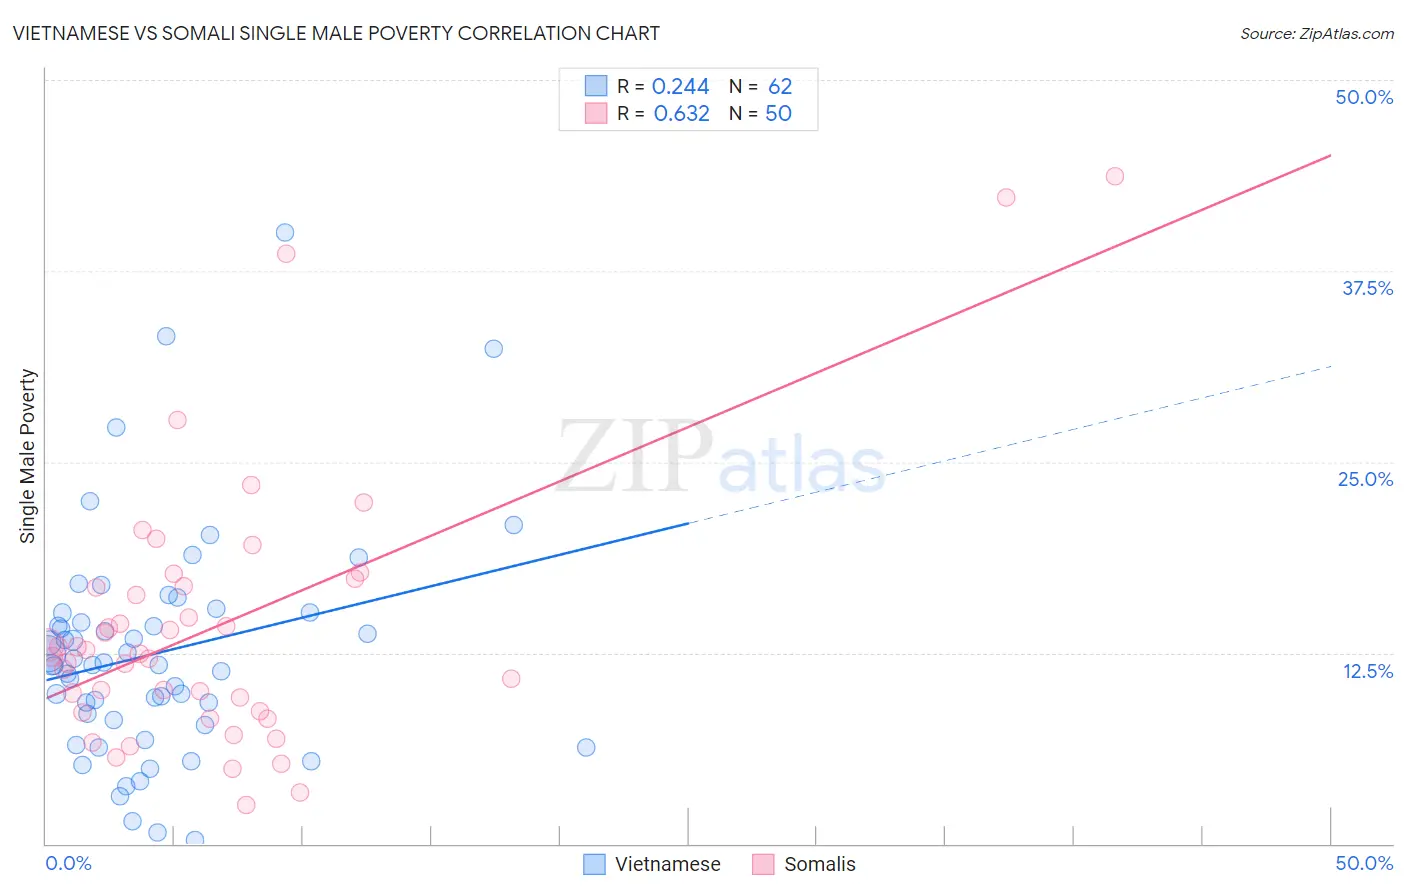
Vietnamese vs Somali Single Male Poverty Correlation Chart

The statistical analysis conducted on geographies consisting of 159,434,170 people shows a weak positive correlation between the proportion of Vietnamese and poverty level among single males in the United States with a correlation coefficient (R) of 0.244 and weighted average of 12.7%. Similarly, the statistical analysis conducted on geographies consisting of 95,264,577 people shows a significant positive correlation between the proportion of Somalis and poverty level among single males in the United States with a correlation coefficient (R) of 0.632 and weighted average of 13.2%, a difference of 4.1%.
Vietnamese vs Somali Single Male Poverty

Single Male Poverty Correlation Summary

MeasurementVietnameseSomali
Minimum0.23%2.6%
Maximum40.0%43.7%
Range39.8%41.1%
Mean12.5%14.2%
Median11.7%12.6%
Interquartile 25% (IQ1)8.1%8.7%
Interquartile 75% (IQ3)15.1%16.8%
Interquartile Range (IQR)7.0%8.1%
Standard Deviation (Sample)7.4%8.7%
Standard Deviation (Population)7.4%8.6%

Similar Demographics by Single Male Poverty

Demographics Similar to Vietnamese by Single Male Poverty

In terms of single male poverty, the demographic groups most similar to Vietnamese are Latvian (12.7%, a difference of 0.0%), Immigrants from Spain (12.7%, a difference of 0.040%), Immigrants from Scotland (12.7%, a difference of 0.060%), Immigrants (12.7%, a difference of 0.13%), and Immigrants from Middle Africa (12.7%, a difference of 0.18%).
DemographicsRating | RankSingle Male Poverty
Sierra Leoneans
73.0
/100
|
#149
Good
12.6%
Immigrants | Panama
72.1
/100
|
#150
Good
12.6%
Immigrants | Hungary
71.9
/100
|
#151
Good
12.6%
Australians
71.4
/100
|
#152
Good
12.6%
Immigrants | Immigrants
70.1
/100
|
#153
Good
12.7%
Immigrants | Scotland
68.9
/100
|
#154
Good
12.7%
Immigrants | Spain
68.7
/100
|
#155
Good
12.7%
Vietnamese
67.9
/100
|
#156
Good
12.7%
Latvians
67.9
/100
|
#157
Good
12.7%
Immigrants | Middle Africa
64.9
/100
|
#158
Good
12.7%
Immigrants | Liberia
64.2
/100
|
#159
Good
12.7%
Greeks
64.1
/100
|
#160
Good
12.7%
Immigrants | Africa
63.4
/100
|
#161
Good
12.7%
Eastern Europeans
63.3
/100
|
#162
Good
12.7%
Palestinians
63.1
/100
|
#163
Good
12.7%

Demographics Similar to Somalis by Single Male Poverty

In terms of single male poverty, the demographic groups most similar to Somalis are Immigrants from the Azores (13.2%, a difference of 0.030%), Immigrants from Denmark (13.2%, a difference of 0.050%), Immigrants from Western Europe (13.2%, a difference of 0.15%), Jamaican (13.2%, a difference of 0.22%), and New Zealander (13.2%, a difference of 0.24%).
DemographicsRating | RankSingle Male Poverty
Bermudans
13.0
/100
|
#217
Poor
13.1%
Scandinavians
12.9
/100
|
#218
Poor
13.1%
Immigrants | Burma/Myanmar
12.6
/100
|
#219
Poor
13.1%
Central Americans
10.9
/100
|
#220
Poor
13.2%
New Zealanders
10.7
/100
|
#221
Poor
13.2%
Immigrants | Western Europe
10.0
/100
|
#222
Poor
13.2%
Immigrants | Azores
9.3
/100
|
#223
Tragic
13.2%
Somalis
9.1
/100
|
#224
Tragic
13.2%
Immigrants | Denmark
8.7
/100
|
#225
Tragic
13.2%
Jamaicans
7.7
/100
|
#226
Tragic
13.2%
Haitians
7.0
/100
|
#227
Tragic
13.2%
Lebanese
6.6
/100
|
#228
Tragic
13.2%
Europeans
6.2
/100
|
#229
Tragic
13.3%
Ghanaians
6.1
/100
|
#230
Tragic
13.3%
Slavs
5.3
/100
|
#231
Tragic
13.3%