Chippewa vs Spanish Child Poverty Among Girls Under 16
COMPARE
Chippewa
Spanish
Child Poverty Among Girls Under 16
Child Poverty Among Girls Under 16 Comparison
Chippewa
Spanish
20.6%
CHILD POVERTY AMONG GIRLS UNDER 16
0.0/ 100
METRIC RATING
291st/ 347
METRIC RANK
16.9%
CHILD POVERTY AMONG GIRLS UNDER 16
28.6/ 100
METRIC RATING
194th/ 347
METRIC RANK
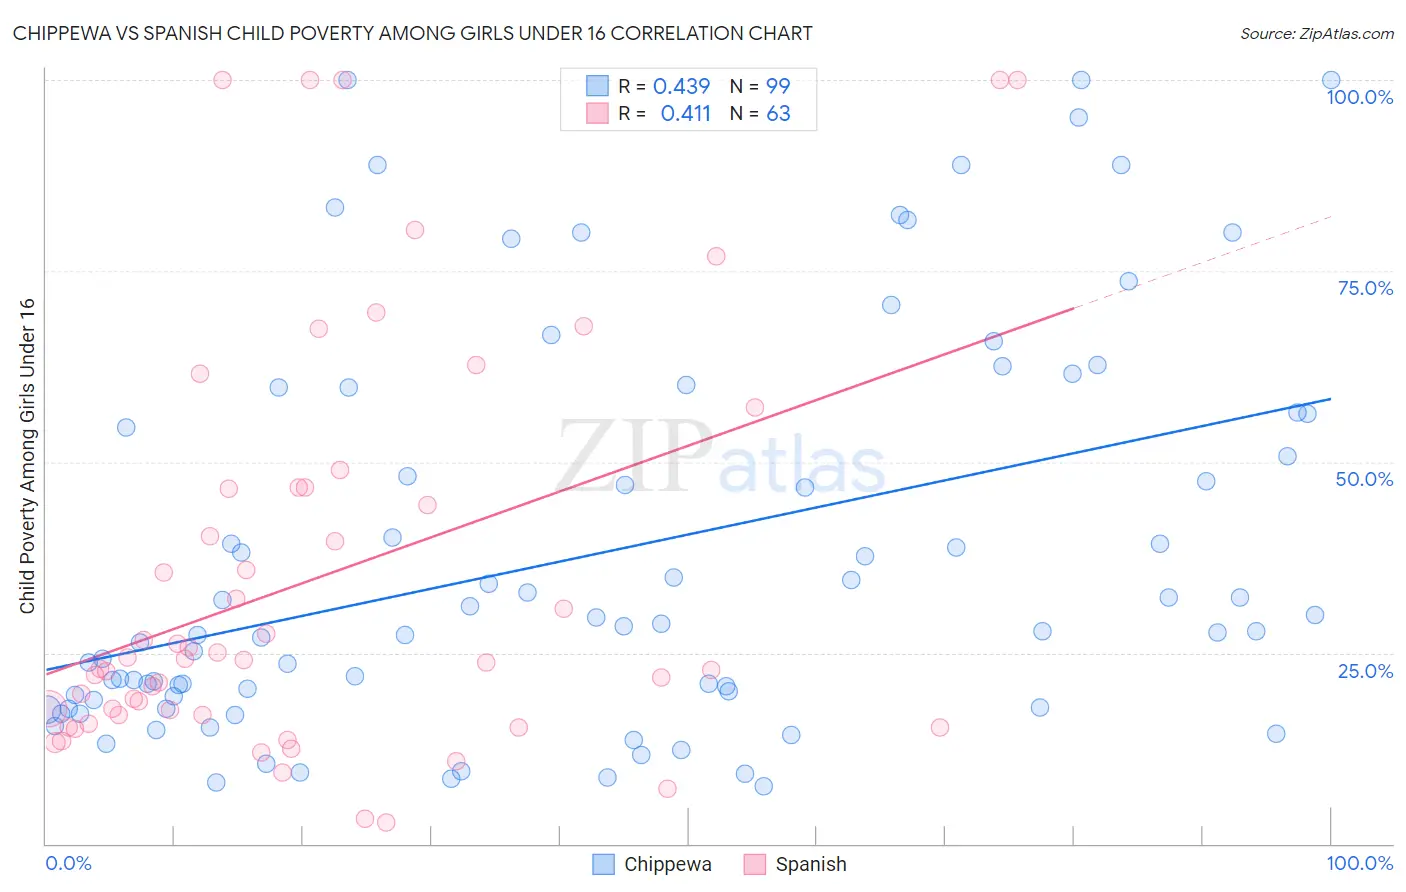
Chippewa vs Spanish Child Poverty Among Girls Under 16 Correlation Chart
The statistical analysis conducted on geographies consisting of 212,813,465 people shows a moderate positive correlation between the proportion of Chippewa and poverty level among girls under the age of 16 in the United States with a correlation coefficient (R) of 0.439 and weighted average of 20.6%. Similarly, the statistical analysis conducted on geographies consisting of 414,340,286 people shows a moderate positive correlation between the proportion of Spanish and poverty level among girls under the age of 16 in the United States with a correlation coefficient (R) of 0.411 and weighted average of 16.9%, a difference of 22.1%.
Child Poverty Among Girls Under 16 Correlation Summary
| Measurement | Chippewa | Spanish |
| Minimum | 7.5% | 2.9% |
| Maximum | 100.0% | 100.0% |
| Range | 92.5% | 97.1% |
| Mean | 37.7% | 34.8% |
| Median | 27.8% | 24.1% |
| Interquartile 25% (IQ1) | 18.9% | 16.8% |
| Interquartile 75% (IQ3) | 56.3% | 46.7% |
| Interquartile Range (IQR) | 37.5% | 29.9% |
| Standard Deviation (Sample) | 25.5% | 26.6% |
| Standard Deviation (Population) | 25.4% | 26.4% |
Similar Demographics by Child Poverty Among Girls Under 16
Demographics Similar to Chippewa by Child Poverty Among Girls Under 16
In terms of child poverty among girls under 16, the demographic groups most similar to Chippewa are Immigrants from Latin America (20.6%, a difference of 0.070%), Immigrants from Grenada (20.7%, a difference of 0.11%), Immigrants from Haiti (20.6%, a difference of 0.13%), Immigrants from Belize (20.6%, a difference of 0.20%), and Immigrants from Senegal (20.7%, a difference of 0.22%).
| Demographics | Rating | Rank | Child Poverty Among Girls Under 16 |
| Yaqui | 0.0 /100 | #284 | Tragic 20.3% |
| Immigrants | Cabo Verde | 0.0 /100 | #285 | Tragic 20.3% |
| Iroquois | 0.0 /100 | #286 | Tragic 20.4% |
| Blackfeet | 0.0 /100 | #287 | Tragic 20.5% |
| Haitians | 0.0 /100 | #288 | Tragic 20.5% |
| Immigrants | Belize | 0.0 /100 | #289 | Tragic 20.6% |
| Immigrants | Haiti | 0.0 /100 | #290 | Tragic 20.6% |
| Chippewa | 0.0 /100 | #291 | Tragic 20.6% |
| Immigrants | Latin America | 0.0 /100 | #292 | Tragic 20.6% |
| Immigrants | Grenada | 0.0 /100 | #293 | Tragic 20.7% |
| Immigrants | Senegal | 0.0 /100 | #294 | Tragic 20.7% |
| Immigrants | Caribbean | 0.0 /100 | #295 | Tragic 20.7% |
| Immigrants | West Indies | 0.0 /100 | #296 | Tragic 20.7% |
| Inupiat | 0.0 /100 | #297 | Tragic 20.8% |
| Mexicans | 0.0 /100 | #298 | Tragic 20.9% |
Demographics Similar to Spanish by Child Poverty Among Girls Under 16
In terms of child poverty among girls under 16, the demographic groups most similar to Spanish are Aleut (16.9%, a difference of 0.010%), Immigrants from Uganda (16.8%, a difference of 0.36%), Immigrants from the Azores (16.8%, a difference of 0.37%), Immigrants from Costa Rica (17.0%, a difference of 0.43%), and Celtic (17.0%, a difference of 0.48%).
| Demographics | Rating | Rank | Child Poverty Among Girls Under 16 |
| Immigrants | Morocco | 34.6 /100 | #187 | Fair 16.8% |
| Arabs | 34.5 /100 | #188 | Fair 16.8% |
| Immigrants | Bosnia and Herzegovina | 32.5 /100 | #189 | Fair 16.8% |
| Kenyans | 32.3 /100 | #190 | Fair 16.8% |
| Immigrants | Azores | 31.3 /100 | #191 | Fair 16.8% |
| Immigrants | Uganda | 31.3 /100 | #192 | Fair 16.8% |
| Aleuts | 28.7 /100 | #193 | Fair 16.9% |
| Spanish | 28.6 /100 | #194 | Fair 16.9% |
| Immigrants | Costa Rica | 25.6 /100 | #195 | Fair 17.0% |
| Celtics | 25.2 /100 | #196 | Fair 17.0% |
| Spaniards | 24.9 /100 | #197 | Fair 17.0% |
| Immigrants | Lebanon | 22.6 /100 | #198 | Fair 17.1% |
| Immigrants | Afghanistan | 22.4 /100 | #199 | Fair 17.1% |
| Immigrants | Uzbekistan | 21.5 /100 | #200 | Fair 17.1% |
| Immigrants | Kenya | 17.8 /100 | #201 | Poor 17.2% |