Immigrants from Guyana vs Spanish Child Poverty Among Girls Under 16
COMPARE
Immigrants from Guyana
Spanish
Child Poverty Among Girls Under 16
Child Poverty Among Girls Under 16 Comparison
Immigrants from Guyana
Spanish
19.3%
CHILD POVERTY AMONG GIRLS UNDER 16
0.3/ 100
METRIC RATING
253rd/ 347
METRIC RANK
16.9%
CHILD POVERTY AMONG GIRLS UNDER 16
28.6/ 100
METRIC RATING
194th/ 347
METRIC RANK
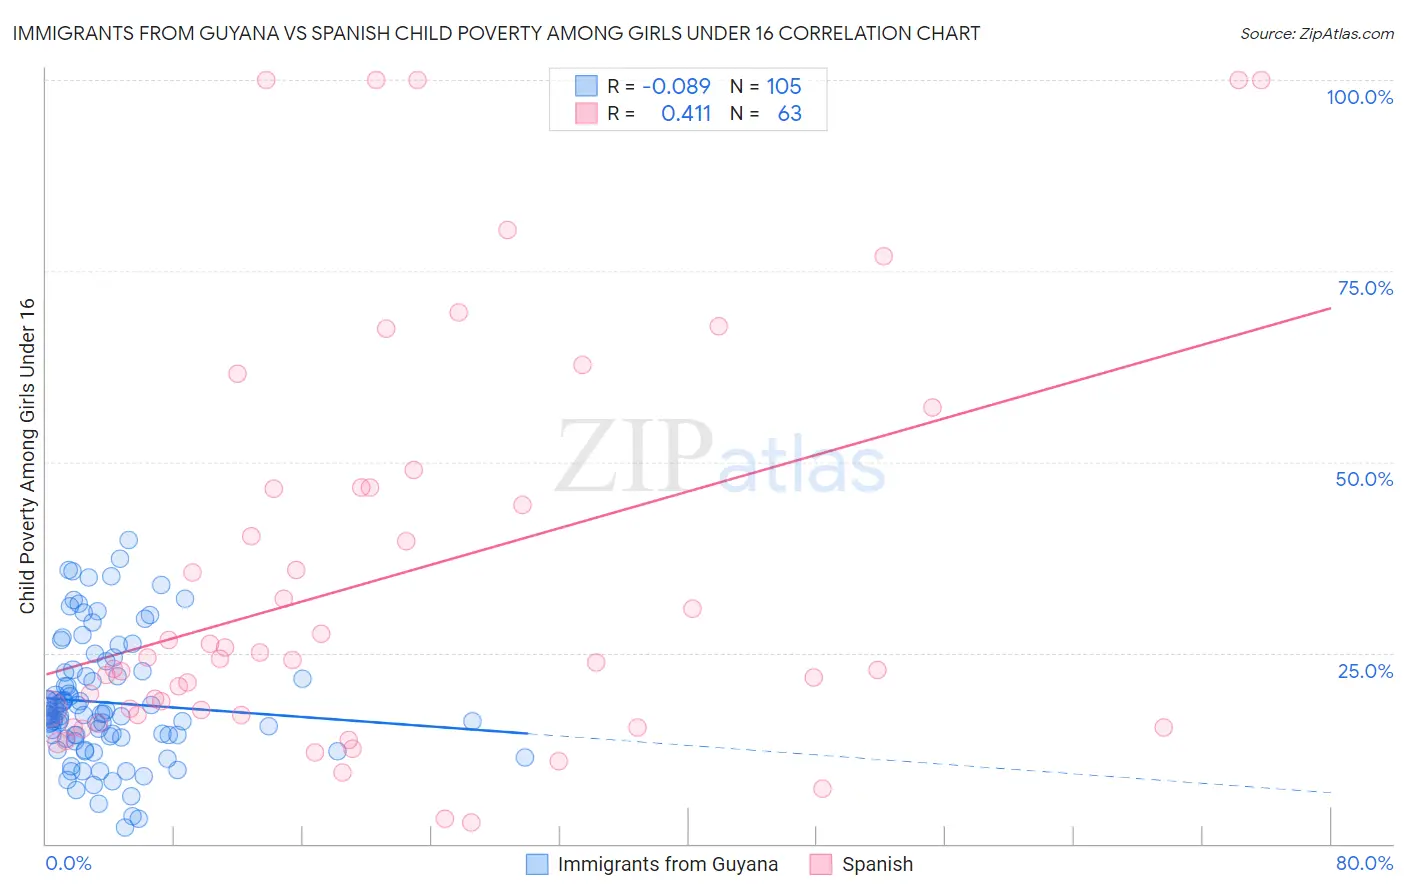
Immigrants from Guyana vs Spanish Child Poverty Among Girls Under 16 Correlation Chart
The statistical analysis conducted on geographies consisting of 181,781,913 people shows a slight negative correlation between the proportion of Immigrants from Guyana and poverty level among girls under the age of 16 in the United States with a correlation coefficient (R) of -0.089 and weighted average of 19.3%. Similarly, the statistical analysis conducted on geographies consisting of 414,340,286 people shows a moderate positive correlation between the proportion of Spanish and poverty level among girls under the age of 16 in the United States with a correlation coefficient (R) of 0.411 and weighted average of 16.9%, a difference of 14.1%.
Child Poverty Among Girls Under 16 Correlation Summary
| Measurement | Immigrants from Guyana | Spanish |
| Minimum | 2.1% | 2.9% |
| Maximum | 39.8% | 100.0% |
| Range | 37.6% | 97.1% |
| Mean | 18.5% | 34.8% |
| Median | 16.9% | 24.1% |
| Interquartile 25% (IQ1) | 14.0% | 16.8% |
| Interquartile 75% (IQ3) | 22.5% | 46.7% |
| Interquartile Range (IQR) | 8.5% | 29.9% |
| Standard Deviation (Sample) | 8.1% | 26.6% |
| Standard Deviation (Population) | 8.0% | 26.4% |
Similar Demographics by Child Poverty Among Girls Under 16
Demographics Similar to Immigrants from Guyana by Child Poverty Among Girls Under 16
In terms of child poverty among girls under 16, the demographic groups most similar to Immigrants from Guyana are Immigrants from Western Africa (19.3%, a difference of 0.060%), Immigrants from Ecuador (19.3%, a difference of 0.080%), Trinidadian and Tobagonian (19.3%, a difference of 0.15%), Immigrants from Middle Africa (19.2%, a difference of 0.20%), and Immigrants from Trinidad and Tobago (19.2%, a difference of 0.23%).
| Demographics | Rating | Rank | Child Poverty Among Girls Under 16 |
| Immigrants | Laos | 0.6 /100 | #246 | Tragic 18.9% |
| Immigrants | Ghana | 0.5 /100 | #247 | Tragic 18.9% |
| French American Indians | 0.3 /100 | #248 | Tragic 19.2% |
| Potawatomi | 0.3 /100 | #249 | Tragic 19.2% |
| Cape Verdeans | 0.3 /100 | #250 | Tragic 19.2% |
| Immigrants | Trinidad and Tobago | 0.3 /100 | #251 | Tragic 19.2% |
| Immigrants | Middle Africa | 0.3 /100 | #252 | Tragic 19.2% |
| Immigrants | Guyana | 0.3 /100 | #253 | Tragic 19.3% |
| Immigrants | Western Africa | 0.3 /100 | #254 | Tragic 19.3% |
| Immigrants | Ecuador | 0.3 /100 | #255 | Tragic 19.3% |
| Trinidadians and Tobagonians | 0.2 /100 | #256 | Tragic 19.3% |
| Guyanese | 0.2 /100 | #257 | Tragic 19.4% |
| Salvadorans | 0.2 /100 | #258 | Tragic 19.4% |
| Ottawa | 0.2 /100 | #259 | Tragic 19.4% |
| Mexican American Indians | 0.2 /100 | #260 | Tragic 19.5% |
Demographics Similar to Spanish by Child Poverty Among Girls Under 16
In terms of child poverty among girls under 16, the demographic groups most similar to Spanish are Aleut (16.9%, a difference of 0.010%), Immigrants from Uganda (16.8%, a difference of 0.36%), Immigrants from the Azores (16.8%, a difference of 0.37%), Immigrants from Costa Rica (17.0%, a difference of 0.43%), and Celtic (17.0%, a difference of 0.48%).
| Demographics | Rating | Rank | Child Poverty Among Girls Under 16 |
| Immigrants | Morocco | 34.6 /100 | #187 | Fair 16.8% |
| Arabs | 34.5 /100 | #188 | Fair 16.8% |
| Immigrants | Bosnia and Herzegovina | 32.5 /100 | #189 | Fair 16.8% |
| Kenyans | 32.3 /100 | #190 | Fair 16.8% |
| Immigrants | Azores | 31.3 /100 | #191 | Fair 16.8% |
| Immigrants | Uganda | 31.3 /100 | #192 | Fair 16.8% |
| Aleuts | 28.7 /100 | #193 | Fair 16.9% |
| Spanish | 28.6 /100 | #194 | Fair 16.9% |
| Immigrants | Costa Rica | 25.6 /100 | #195 | Fair 17.0% |
| Celtics | 25.2 /100 | #196 | Fair 17.0% |
| Spaniards | 24.9 /100 | #197 | Fair 17.0% |
| Immigrants | Lebanon | 22.6 /100 | #198 | Fair 17.1% |
| Immigrants | Afghanistan | 22.4 /100 | #199 | Fair 17.1% |
| Immigrants | Uzbekistan | 21.5 /100 | #200 | Fair 17.1% |
| Immigrants | Kenya | 17.8 /100 | #201 | Poor 17.2% |