Chippewa vs Cherokee Child Poverty Among Girls Under 16
COMPARE
Chippewa
Cherokee
Child Poverty Among Girls Under 16
Child Poverty Among Girls Under 16 Comparison
Chippewa
Cherokee
20.6%
CHILD POVERTY AMONG GIRLS UNDER 16
0.0/ 100
METRIC RATING
291st/ 347
METRIC RANK
19.9%
CHILD POVERTY AMONG GIRLS UNDER 16
0.1/ 100
METRIC RATING
270th/ 347
METRIC RANK
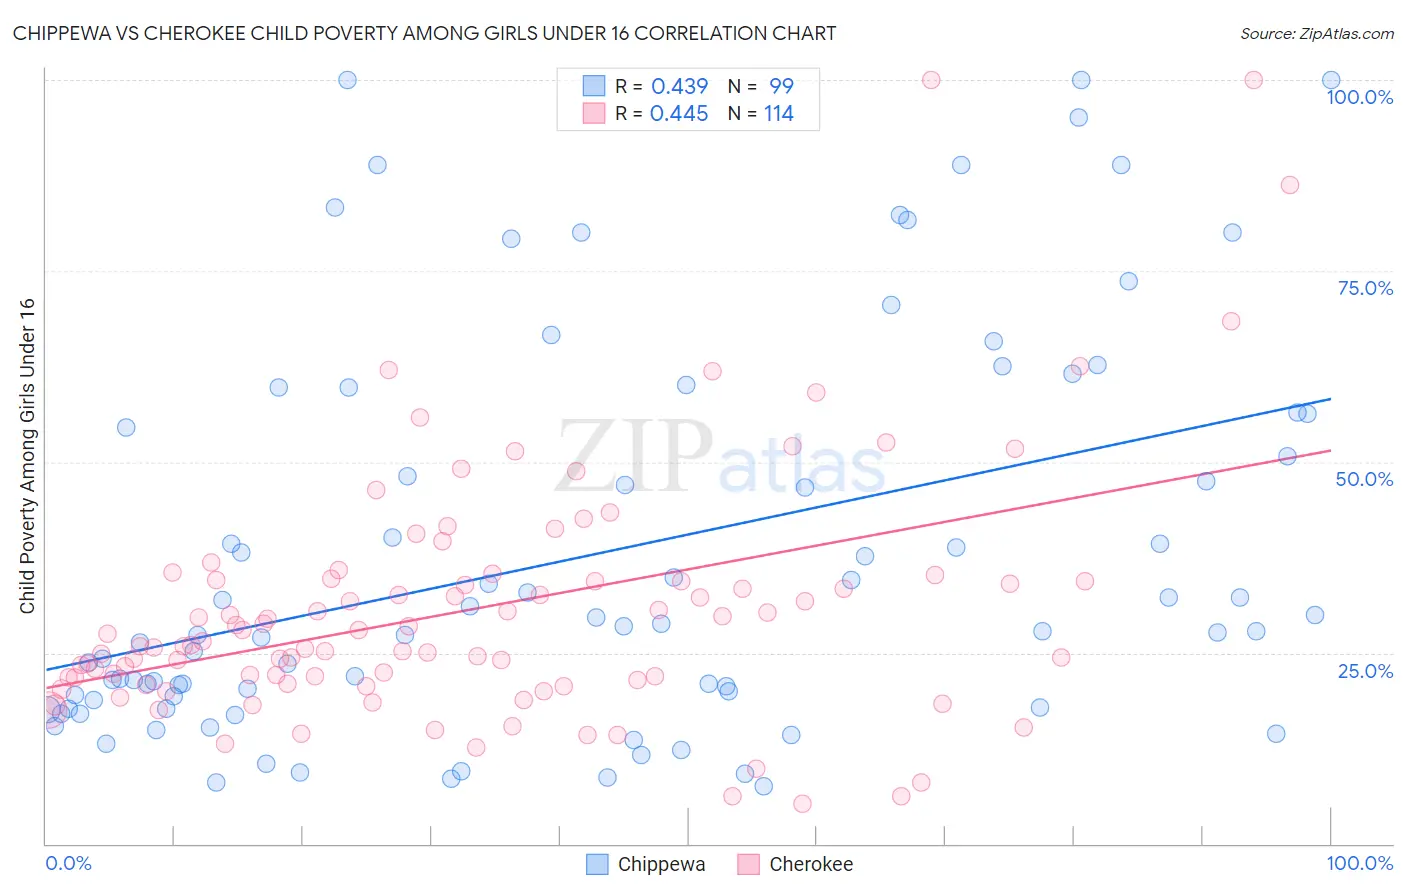
Chippewa vs Cherokee Child Poverty Among Girls Under 16 Correlation Chart
The statistical analysis conducted on geographies consisting of 212,813,465 people shows a moderate positive correlation between the proportion of Chippewa and poverty level among girls under the age of 16 in the United States with a correlation coefficient (R) of 0.439 and weighted average of 20.6%. Similarly, the statistical analysis conducted on geographies consisting of 483,336,049 people shows a moderate positive correlation between the proportion of Cherokee and poverty level among girls under the age of 16 in the United States with a correlation coefficient (R) of 0.445 and weighted average of 19.9%, a difference of 3.6%.
Child Poverty Among Girls Under 16 Correlation Summary
| Measurement | Chippewa | Cherokee |
| Minimum | 7.5% | 5.3% |
| Maximum | 100.0% | 100.0% |
| Range | 92.5% | 94.7% |
| Mean | 37.7% | 30.7% |
| Median | 27.8% | 26.2% |
| Interquartile 25% (IQ1) | 18.9% | 21.4% |
| Interquartile 75% (IQ3) | 56.3% | 34.5% |
| Interquartile Range (IQR) | 37.5% | 13.1% |
| Standard Deviation (Sample) | 25.5% | 16.5% |
| Standard Deviation (Population) | 25.4% | 16.4% |
Similar Demographics by Child Poverty Among Girls Under 16
Demographics Similar to Chippewa by Child Poverty Among Girls Under 16
In terms of child poverty among girls under 16, the demographic groups most similar to Chippewa are Immigrants from Latin America (20.6%, a difference of 0.070%), Immigrants from Grenada (20.7%, a difference of 0.11%), Immigrants from Haiti (20.6%, a difference of 0.13%), Immigrants from Belize (20.6%, a difference of 0.20%), and Immigrants from Senegal (20.7%, a difference of 0.22%).
| Demographics | Rating | Rank | Child Poverty Among Girls Under 16 |
| Yaqui | 0.0 /100 | #284 | Tragic 20.3% |
| Immigrants | Cabo Verde | 0.0 /100 | #285 | Tragic 20.3% |
| Iroquois | 0.0 /100 | #286 | Tragic 20.4% |
| Blackfeet | 0.0 /100 | #287 | Tragic 20.5% |
| Haitians | 0.0 /100 | #288 | Tragic 20.5% |
| Immigrants | Belize | 0.0 /100 | #289 | Tragic 20.6% |
| Immigrants | Haiti | 0.0 /100 | #290 | Tragic 20.6% |
| Chippewa | 0.0 /100 | #291 | Tragic 20.6% |
| Immigrants | Latin America | 0.0 /100 | #292 | Tragic 20.6% |
| Immigrants | Grenada | 0.0 /100 | #293 | Tragic 20.7% |
| Immigrants | Senegal | 0.0 /100 | #294 | Tragic 20.7% |
| Immigrants | Caribbean | 0.0 /100 | #295 | Tragic 20.7% |
| Immigrants | West Indies | 0.0 /100 | #296 | Tragic 20.7% |
| Inupiat | 0.0 /100 | #297 | Tragic 20.8% |
| Mexicans | 0.0 /100 | #298 | Tragic 20.9% |
Demographics Similar to Cherokee by Child Poverty Among Girls Under 16
In terms of child poverty among girls under 16, the demographic groups most similar to Cherokee are Immigrants from Barbados (19.9%, a difference of 0.10%), Liberian (19.9%, a difference of 0.18%), Immigrants from El Salvador (20.0%, a difference of 0.21%), Spanish American Indian (19.9%, a difference of 0.28%), and Immigrants from Bangladesh (19.9%, a difference of 0.32%).
| Demographics | Rating | Rank | Child Poverty Among Girls Under 16 |
| Immigrants | Burma/Myanmar | 0.1 /100 | #263 | Tragic 19.7% |
| Jamaicans | 0.1 /100 | #264 | Tragic 19.7% |
| Immigrants | Jamaica | 0.1 /100 | #265 | Tragic 19.8% |
| Spanish Americans | 0.1 /100 | #266 | Tragic 19.8% |
| Immigrants | Bangladesh | 0.1 /100 | #267 | Tragic 19.9% |
| Spanish American Indians | 0.1 /100 | #268 | Tragic 19.9% |
| Liberians | 0.1 /100 | #269 | Tragic 19.9% |
| Cherokee | 0.1 /100 | #270 | Tragic 19.9% |
| Immigrants | Barbados | 0.1 /100 | #271 | Tragic 19.9% |
| Immigrants | El Salvador | 0.1 /100 | #272 | Tragic 20.0% |
| Bangladeshis | 0.1 /100 | #273 | Tragic 20.0% |
| Immigrants | St. Vincent and the Grenadines | 0.0 /100 | #274 | Tragic 20.1% |
| Sub-Saharan Africans | 0.0 /100 | #275 | Tragic 20.1% |
| Comanche | 0.0 /100 | #276 | Tragic 20.2% |
| Belizeans | 0.0 /100 | #277 | Tragic 20.2% |